Images emerging from the Hubble space telescope have revealed a
number of planetary nebulae and galaxies with complex and varied
morphologies. While different mechanisms have been proposed to
influence certain galactic forms, the mechanisms that drive the
diverse morphologies are not yet well-understood.
The goal of this Chapter is to apply the UG theory to large
astronomical objects, such as nebulae and galaxies, and to
demonstrate the viability of the theory by explaining how relatively
simple SHP configurations can provide the mechanism which drives the
creation and maintenance of a number of poorly understood galactic
morphologies and properties, including the mechanism responsible for
the creation and maintenance of the various types of spiral
galaxies.
Section IV-I: Two Dimensional
Potential Energy Mapping and Derivation of Morphology
The
structure and dynamics of galaxies and nebulae can be analyzed using
the equations developed in Chapter III. Specifically, equation
3-1-20 will be applied to a number of observed morphologies with the
anticipation that the level of radiation emitted from a given section
of a galaxy should be greater in areas of higher density. The maxima
and minima of the radiation are thus expected to follow the
respective patterns of the minima and maxima of the ordinary matter
potential energy.
Equation
3-1-20 
 and
and
 denote the number of superheavy particles of SHP mass
 in the first and second SHP groups of a binary, where both groups
travel in a circular orbit of radius
in the first and second SHP groups of a binary, where both groups
travel in a circular orbit of radius
 around the center of the galaxy at a constant speed
 and are collinear with the center. A vast majority of the ordinary
matter
and are collinear with the center. A vast majority of the ordinary
matter
 is assumed to be distributed in a spherically symmetric1
organization within a sphere of radius
is assumed to be distributed in a spherically symmetric1
organization within a sphere of radius
 around the center of the given galaxy. The orbiting object is assumed
to contain
around the center of the given galaxy. The orbiting object is assumed
to contain
 particles of mass
 ,
and to move at a non-relativistic velocity ,
and to move at a non-relativistic velocity
 relative to the center of the galaxy. The terms
 and
and
 provide the distances traveled by the gravitational signals between
the time of their emission by the two groups (
provide the distances traveled by the gravitational signals between
the time of their emission by the two groups ( times
times
 and
and
 )
and the
time )
and the
time
 of their interception by the object as measured in the respective
SHP group inertial frames of reference at the time of emission, and
are given by (see equations 3-1-17a and b of Chapter III)
of their interception by the object as measured in the respective
SHP group inertial frames of reference at the time of emission, and
are given by (see equations 3-1-17a and b of Chapter III)
Equation
3-1-17a 
and
Equation
3-1-17b 
The
times
and
are approximated by
Equation
3 -15
and Equation
3-1-6
where
the speed of gravitation
 is assumed to be equal the speed of light
 and
and
 .
Equation 3-1-20 includes two potential energy terms
contributed by the two SHP groups, .
Equation 3-1-20 includes two potential energy terms
contributed by the two SHP groups,
 and and ,a potential energy term contributed by the galaxys
ordinary matter ,a potential energy term contributed by the galaxys
ordinary matter  , as well as the non-relativistic objects kinetic energy term
 and its rest mass energy term and its rest mass energy term  The kinetic energy term shifts the actual orbit of the object in
the outward direction from the potential energy minima (to balance
the centrifugal force). However, the existence of kinetic energy
simply pushes the
The kinetic energy term shifts the actual orbit of the object in
the outward direction from the potential energy minima (to balance
the centrifugal force). However, the existence of kinetic energy
simply pushes the  energy minimum contour to somewhere between the
potential energy minimum and the
energy minimum contour to somewhere between the
potential energy minimum and the  maximum contour. The visual effect of this shift on the morphology
of the galaxy is relatively small and should not bear a significant
influence on the galaxys overall morphology. Moreover, the
rest mass energy term is independent of the location of the particle
within the galaxy and therefore does not affect the location of the
minima or, consequently, the galaxys morphology. Therefore,
the following two dimensional maps will omit the kinetic energy and
the rest mass energy terms, and will display only the relevant
potential energy terms. Overall, these changes lead to the highest
levels of ordinary matter (and therefore the highest level of
radiation) at close proximity to the minima of the following
equation:
maximum contour. The visual effect of this shift on the morphology
of the galaxy is relatively small and should not bear a significant
influence on the galaxys overall morphology. Moreover, the
rest mass energy term is independent of the location of the particle
within the galaxy and therefore does not affect the location of the
minima or, consequently, the galaxys morphology. Therefore,
the following two dimensional maps will omit the kinetic energy and
the rest mass energy terms, and will display only the relevant
potential energy terms. Overall, these changes lead to the highest
levels of ordinary matter (and therefore the highest level of
radiation) at close proximity to the minima of the following
equation:
Equation
4-1-1a 
or Equation
4-1-1b 
Note
that the observational resolution within galaxies
and nebulae is of the order of  (
is about
(
is about  ),
which is far greater than ),
which is far greater than  The term
  is therefore indistinguishable from
  ,
and may be replaced by it. ,
and may be replaced by it. The
following succession of examples will illustrate how the different
parameters
,
,
,
 (or equivalently
 ),
and ),
and
 of equation 4-1-1a (or 4-1-1b) affect the morphology, dynamics and
classification of a galaxy (or nebula) and its interaction with
companion galaxies. Note that multiplying equation 4-1-1b by any
constant greater than zero would not affect the location of its
minima, and therefore would not alter the morphology of the nebula or
galaxy. Therefore, the morphology is independent of the number of
ordinary particles of mass
of the object, denoted
,
and setting the value
of equation 4-1-1a (or 4-1-1b) affect the morphology, dynamics and
classification of a galaxy (or nebula) and its interaction with
companion galaxies. Note that multiplying equation 4-1-1b by any
constant greater than zero would not affect the location of its
minima, and therefore would not alter the morphology of the nebula or
galaxy. Therefore, the morphology is independent of the number of
ordinary particles of mass
of the object, denoted
,
and setting the value
 will provide the same morphology. Similarly, when the equation is
written in the form given by 4-1-1b (where
is replaced by
will provide the same morphology. Similarly, when the equation is
written in the form given by 4-1-1b (where
is replaced by
 within the parentheses) the morphology of the galaxy is unaltered by
the replacement of
by
(as long as
is replaced by the original value of
).2
within the parentheses) the morphology of the galaxy is unaltered by
the replacement of
by
(as long as
is replaced by the original value of
).2
The general approach taken here is to modify the remaining
parameters one or two at a time, and to review how morphology (and
therefore morphological classification, such as the Hubble
classification) changes continuously with variation of the individual
parameters. We begin with the parameters
and
,
followed by
,
and
.
Section IV-1-1:
Low Velocity SHP Group Rotation
In
the following discussion it is assumed that while the rotational
velocity of the given galaxy as a whole is fast enough to flatten the
galactic plane into a rotating disk, the velocities of its SHP groups
are still relatively low. For the provided examples, slow
SHP group rotation implies that the velocity of the SHP group(s) is
non-relativistic ( )
and that the distance traveled by the SHP group during the time it
takes the gravitational signal to propagate from the SHP group to the
orbiting object is negligible. )
and that the distance traveled by the SHP group during the time it
takes the gravitational signal to propagate from the SHP group to the
orbiting object is negligible.
The density of matter begins to decline rapidly beyond the farthest
major minimum contour (beyond the radius of the
 minimum
 of the dominant SHP)
 at at
 .
Therefore, the galaxy is mainly visible at .
Therefore, the galaxy is mainly visible at
 ,
which defines the outer borders of the galactic disk. For the case
of an object located at a distance ,
which defines the outer borders of the galactic disk. For the case
of an object located at a distance
 from the galaxy center where
 ,
it takes the gravitational signal approximately ,
it takes the gravitational signal approximately
 seconds to pass the distance between the SHP group and the orbiting
object. During this period of time the SHP group(s) rotates by an
angle of
seconds to pass the distance between the SHP group and the orbiting
object. During this period of time the SHP group(s) rotates by an
angle of
 .
For this amount of rotation to be insignificant
must comply with3 .
For this amount of rotation to be insignificant
must comply with3 Equation
4-1-2 
Figure
4-1 presents a two dimensional map of the calculated potential energy
of an ordinary particle of mass
as a function of its location
 in the rotational disk plane of a simple hypothetical object
containing a single stationary SHP of mass
in the rotational disk plane of a simple hypothetical object
containing a single stationary SHP of mass
 at its center. The figure was derived via equation 4-1-1a using the
parameters
at its center. The figure was derived via equation 4-1-1a using the
parameters
 , ,
 , ,
 ,
, ,
,
 , ,
 ,
and ,
and
 ).
The potential energy is demonstrated via a color-coded map, where
brighter color values indicate lower potential energy and darker
colors represent higher potential energy levels. The upper curve
provides the potential energy along the ).
The potential energy is demonstrated via a color-coded map, where
brighter color values indicate lower potential energy and darker
colors represent higher potential energy levels. The upper curve
provides the potential energy along the
 axis, and its minima and maxima thus correspond to the light and dark
color values respectively along the
axis. In order to create the two dimensional map, a set of
axis, and its minima and maxima thus correspond to the light and dark
color values respectively along the
axis. In order to create the two dimensional map, a set of
 energy threshold levels
 were selected, where
 is an integer (
 and
and
 when
when
 ).
Each location ).
Each location
 on the rotating disk at
 at time
was layered in yellow once for each
value, where
at time
was layered in yellow once for each
value, where
 of equation 4-1-1a is greater than
 Therefore, an area where the potential energy is higher than the
highest energy threshold
Therefore, an area where the potential energy is higher than the
highest energy threshold
 is layered
 times and appears very dark. An area where the potential energy
 complies with
 is layered by a single layer of color and appears as light yellow.
An area with a potential energy
is layered by a single layer of color and appears as light yellow.
An area with a potential energy
 remains unlayered and consequently appears white.
Figure
4-1: The lower image
displays the two dimensional color map of the calculated potential
energy of an ordinary particle of mass  as a function of its
location
as a function of its
location  for the case of a single stationary SHP
group located at
for the case of a single stationary SHP
group located at  and composed of a single SHP
of mass
and composed of a single SHP
of mass  The upper image provides the potential energy along the
  axis, and is displayed in order to identify the exact minima
locations. A contour that is brighter than its immediate neighboring
contours is at a local minimum of the potential energy, while a
contour that is darker than its immediate neighboring contours is at
a local maximum. Calculations were performed via equation 4-1-1a
using the following values:
axis, and is displayed in order to identify the exact minima
locations. A contour that is brighter than its immediate neighboring
contours is at a local minimum of the potential energy, while a
contour that is darker than its immediate neighboring contours is at
a local maximum. Calculations were performed via equation 4-1-1a
using the following values:  , ,
 , ,
 , ,
 , ,
 , ,
 , ,
 , ,
 , ,
 . .
The
resultant two dimensional map displays concentric contours of maxima
and minima, with an increasing density of zones as the distance to
the galaxy center is reduced. Since on galactic scales
 ,
the potential energy of the maxima is equal to ,
the potential energy of the maxima is equal to
 ,
while the minima contours are virtually at zero energy.4 ,
while the minima contours are virtually at zero energy.4 The pattern of the
matter density of a galaxy centered around a single SHP group
provides for the existence of rings, however does not account for the
existence of stellar systems. Stellar systems can be explained with
the introduction of the concept of multiple SHP groups. In the
following section, star formation will be addressed in the special
case of stationary or very slow rotating binary SHP groups.
Section IV-1-2: Star Formation via
Binary SHP groups
A two dimensional
map of a hypothetical galaxy containing two identical stationary
superheavy particle groups separated by some arbitrary distance
 is demonstrated in figures 4-2a to 4-2e (using
 , ,
 , ,
 , ,
 and and ).
The two sets of concentric minima contours contributed by the two
SHP groups to the overall potential energy of the test particle are
shown in 4-2a to 4-2d, where the minima of SHP group 1 are indicated
in blue and the minima of SHP group 2 are indicated in violet.5
As the discussion is limited to the case where both SHP groups are
composed of the same single SHP of mass
,
the two sets of circular contours are identical and are shifted from
each other by a distance of ).
The two sets of concentric minima contours contributed by the two
SHP groups to the overall potential energy of the test particle are
shown in 4-2a to 4-2d, where the minima of SHP group 1 are indicated
in blue and the minima of SHP group 2 are indicated in violet.5
As the discussion is limited to the case where both SHP groups are
composed of the same single SHP of mass
,
the two sets of circular contours are identical and are shifted from
each other by a distance of
 .
Any pair of minima circles respectively generated by SHP group 1 and
SHP group 2 may either intersect at one or two points, or may not
intersect at all. As the overall potential energy of a test particle
at any given location is equal to the sum of the potential energy
contributed by each of the SHP groups, the lowest minima will occur
at any point where a minimum circular contour produced by group 1
intersects with a circular minimum contour produced by group 2. At
these points, both cosine terms in equation 4-1-1a are equal to
.6
The density of ordinary matter is thus expected to peak at these
local minima, where dense clouds of gas are subsequently formed. The
collapse of these dense and massive clouds may lead to star
formation and to the creation of the panoramic night sky view on a
global scale.7 .
Any pair of minima circles respectively generated by SHP group 1 and
SHP group 2 may either intersect at one or two points, or may not
intersect at all. As the overall potential energy of a test particle
at any given location is equal to the sum of the potential energy
contributed by each of the SHP groups, the lowest minima will occur
at any point where a minimum circular contour produced by group 1
intersects with a circular minimum contour produced by group 2. At
these points, both cosine terms in equation 4-1-1a are equal to
.6
The density of ordinary matter is thus expected to peak at these
local minima, where dense clouds of gas are subsequently formed. The
collapse of these dense and massive clouds may lead to star
formation and to the creation of the panoramic night sky view on a
global scale.7 A minimum circle
created by the first SHP group will not intersect with a minimum
circle created by the second SHP group if the sum of their radii is
shorter than
,
or when the difference between their two radii is larger than
.
Pairs of minima circles, where the sum of their radii is greater
than
and the difference between their radii is less than
,
intersect at exactly two distinct points. Theoretically, when the
sum or the difference of the two radii are exactly
,
the pair of circles can intersect only at a single point. However,
in reality, when the sum or the difference of the radii approach the
exact value of
,
the two intersecting points approach each other, and the two circular
arcs located between the two intersecting points nearly overlap to
create a minimum arc at which the density of matter is high.8 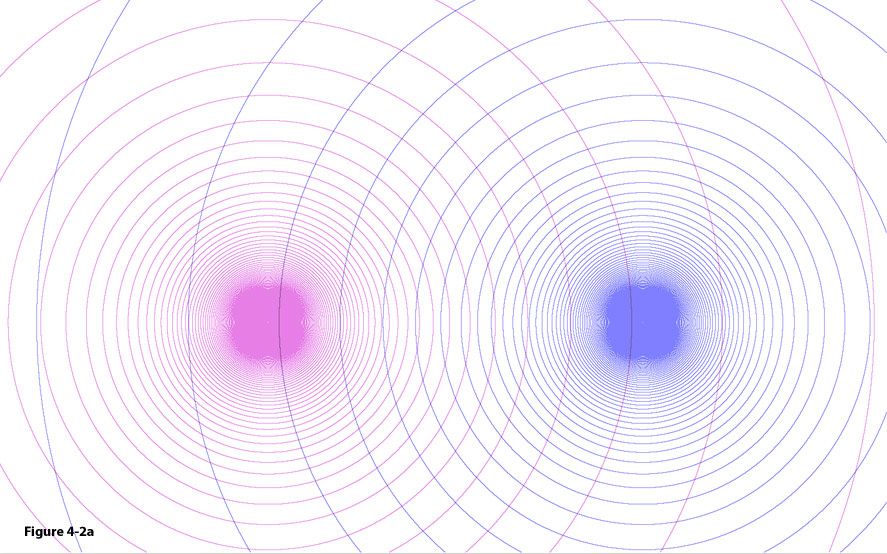
Figure
4-2a: The
intersections of the minima contours of two SHP
groups create local minima where clouds of gas are formed. The
collapse of these clouds generates star formation.
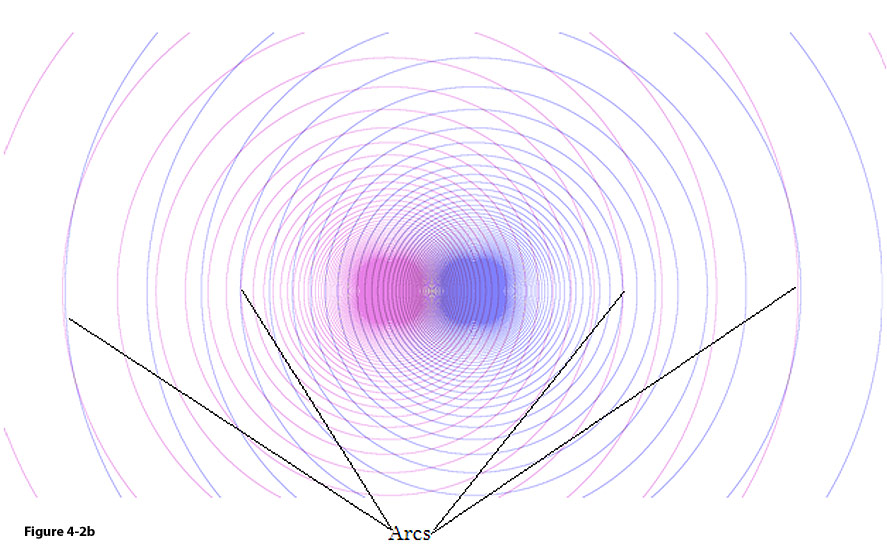
Figure
4-2b: Decreasing the
distance between the SHP
groups substantially increases the number of intersections (and thus
the number of stars
formed). Note the occasional occurrence of arcs, which resemble the
appearance of filaments.
As demonstrated in figures 4-2b and
c, such arcs (or filaments) are formed by the intersection of minima
circles with radii that comply with
 .
Note that the arcs are perpendicular to the line connecting the two
SHP groups. As the respective radii .
Note that the arcs are perpendicular to the line connecting the two
SHP groups. As the respective radii
 and and
 of the intersecting circles increase, the length of the arc increases
as well. At sufficiently low zonal indices, where the difference
between two successive minima is larger than
,
the two circular contours can intersect only if their radii are equal
(
of the intersecting circles increase, the length of the arc increases
as well. At sufficiently low zonal indices, where the difference
between two successive minima is larger than
,
the two circular contours can intersect only if their radii are equal
( ),
creating two arcs around the two intersection points.9 ),
creating two arcs around the two intersection points.9
Figure
4-2c: As the distance
between the SHP groups
reduces, further pattern changes can be noted in the geometrical
pattern near the center of the galaxy. In addition, at large
distances only contours of the same radius (or zonal index) can
intersect.
Figure
4-2d: At a very short
distance  ,
concentric contours are produced and the galaxy becomes almost
indistinguishable from a galaxy containing a single stationary SHP
group located at its center. ,
concentric contours are produced and the galaxy becomes almost
indistinguishable from a galaxy containing a single stationary SHP
group located at its center.
In figure 4-2d, as the distance
 (and therefore
)
increases, the two arcs approach each other to create a full circle,
or a ring. In general, when the ratio between the orbital radius of
the SHP group(s) and the distance of the object from the galaxy
center
(and therefore
)
increases, the two arcs approach each other to create a full circle,
or a ring. In general, when the ratio between the orbital radius of
the SHP group(s) and the distance of the object from the galaxy
center
 ,
equation 4-1-1a results in a galaxy or nebula that demonstrates
essentially the same form as provided by a single SHP group (see
figure 4-1a), where the total number of superheavy particles in the
group is given by the sum ,
equation 4-1-1a results in a galaxy or nebula that demonstrates
essentially the same form as provided by a single SHP group (see
figure 4-1a), where the total number of superheavy particles in the
group is given by the sum
 .
As can be deduced from equation 4-1-1a and demonstrated by figures
4-2a to 4-2d, the number of intersections between the two sets of
concentric minima circles increases as the distance
between the two SHP groups is reduced, creating more star systems. .
As can be deduced from equation 4-1-1a and demonstrated by figures
4-2a to 4-2d, the number of intersections between the two sets of
concentric minima circles increases as the distance
between the two SHP groups is reduced, creating more star systems.
Figure 4-2e provides the two dimensional contour map of the overall
potential energy pattern generated by two identical SHP groups
positioned at
 , ,
 and
and
 .
The number of minima (represented by the brightest areas) increases
and their individual sizes reduce with decreasing distance from
either SHP group. Consequently, stars created in the immediate areas
surrounding the SHP groups are expected to be smaller and more
abundant than those produced at more distant locations. As shown in
the figure, some very large stars should be generated from the gas
trapped at the minima, located for example at .
The number of minima (represented by the brightest areas) increases
and their individual sizes reduce with decreasing distance from
either SHP group. Consequently, stars created in the immediate areas
surrounding the SHP groups are expected to be smaller and more
abundant than those produced at more distant locations. As shown in
the figure, some very large stars should be generated from the gas
trapped at the minima, located for example at
 , ,
 , , and
and
 .
The size of the minima, and therefore the size of the stars produced
within them, should decrease, and the number of stars should increase
as their distance from the SHP groups is reduced. Note that the
darkest areas within close proximity to the SHP groups (within a
radius of about .
The size of the minima, and therefore the size of the stars produced
within them, should decrease, and the number of stars should increase
as their distance from the SHP groups is reduced. Note that the
darkest areas within close proximity to the SHP groups (within a
radius of about
 )
are not continuous and appear so due to the limited resolution of the
figure. These areas actually consist of many distinct minima
separated by maxima, where many thousands of small stars can be
created. Note that some of the minima may be too small to cause a
collapse. )
are not continuous and appear so due to the limited resolution of the
figure. These areas actually consist of many distinct minima
separated by maxima, where many thousands of small stars can be
created. Note that some of the minima may be too small to cause a
collapse. 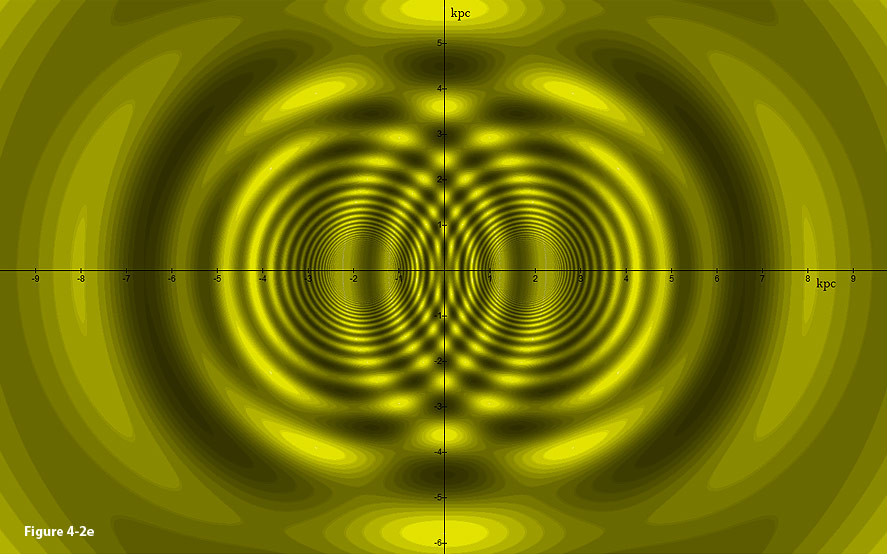
Figure
4-2e: A two
dimensional contour map of the overall potential energy pattern
generated by two identical SHP
groups (positioned at  , ,
 and and ,
where the ,
where the  axis is perpendicular to the page). Star formation may occur at the
isolated minima (displayed as bright circles or bright segments (or
filaments). The size and
the abundance of stars are
determined by their distances from the two SHP
groups. Note that the stars
in the center or mid-region of the galaxy are significantly larger in
size and smaller in number than those near the SHP
groups. Further note the
broad arcs produced at a great distance from the galaxy center.
axis is perpendicular to the page). Star formation may occur at the
isolated minima (displayed as bright circles or bright segments (or
filaments). The size and
the abundance of stars are
determined by their distances from the two SHP
groups. Note that the stars
in the center or mid-region of the galaxy are significantly larger in
size and smaller in number than those near the SHP
groups. Further note the
broad arcs produced at a great distance from the galaxy center.
The sizes of the stars are therefore dependent on the distance
parameter
,
which determines the closest point of intersection to either one of
the SHP groups, and therefore the minimum size of stars produced
within the galaxy.10
As the galaxy center is relatively far from both SHP groups (by as
much as
 in this example), the stars produced at the intersection points close
to the center are expected to be fewer in number and larger in size
than those produced closer to either one of the SHP groups. This
phenomenon was observed near the core of the Milky Way Galaxy
(Courtland, 2008).
in this example), the stars produced at the intersection points close
to the center are expected to be fewer in number and larger in size
than those produced closer to either one of the SHP groups. This
phenomenon was observed near the core of the Milky Way Galaxy
(Courtland, 2008).
An important factor left out of the above discussion is that most of
the galactic SHP groups in the observed galaxies should be rotating.
In the static scenario, where either no rotation or a very slow
rotation takes place, each intersection is potentially capable of
producing a single star, which then remains trapped within the local
minima. However, in the case of rapid SHP group rotation, it will be
shown that following the collapse of a gas cloud, the pattern
generated by the rotating SHP groups will move too fast for the newly
generated stars to keep pace. As the pattern rotates away from the
newly formed stars, new clouds of gas emerge and are forced to
collapse into the shifted minima intersections. This process may
repeat continuously, resulting in the steady creation of a large
number of stars, as long as there is no shortage of interstellar gas.
A more detailed description of the process of star formation,
fragmentation, and the influence of the rotation of SHP groups will
be provided in Chapter VI.11
Extending the discussion, equation 4-1-1a will be applied to map and
evaluate a series of known morphologies that may have been generated
by binary SHP groups. The resultant models will then be compared
with morphologies observed in various galaxies and nebulae. Features
such as multiple rings, arcs, spirals and ansae will also be
considered and explained. Current theories suggest that some of
these features may in part be determined by binary central stars,
external interactions, stellar winds and magnetic fields in the case
of planetary nebulae, or by the gravitational influence of companions
or collisions in the case of galaxies; however the exact mechanisms
which drive the diverse morphologies are not yet well-understood, and
certainly not proven.
We begin using the above scenario of binary SHP groups, each
containing a single type of superheavy particle. The SHP groups may
either remain stationary or may rotate around each other at
relatively low velocity.12
In such a system, the morphology will be shown to be determined
mainly by the value of the parameter
,
which is equal to the orbital radius of a single or binary SHP groups
around the center of the core of the galaxy or nebula.
Section IV-1-3: Butterfly Formations
in Planetary Nebulae
Figure 4-3a provides the two dimensional map of a nebula generated by
two stationary (or slow rotating) SHP groups separated by a distance
of
,
where
 , ,
 , ,
 and the overall mass of ordinary matter in the cloud is about
 (using a single cut-off value of
 ).
The resultant image appears as a butterfly structure composed of
narrow arcs, bearing a close resemblance to the morphology of a
number of axially symmetric, or butterfly nebulae (see
NGC 6302 in figure 4-3b, NGC-2346 in figure 4-3c and the Boomerang
Nebula in figure 4-3d).13
The width of the two outer lobes, or the wings of the
butterfly formation, is determined by the value of
.
The span of the two wings increases as
is reduced, becoming a full circle as
.
Reduction of the ordinary matter effect
will strengthen the butterfly morphology. However, increasing
by a factor larger than ten (in this example) may eliminate the
butterfly pattern, instead creating a pattern of concentric spheres
or circles. Note that for the case of a static or slow-rotating
nebula, the nebular structure is not reduced to a thin rotating disk
and retains substantial depth. Therefore, the minima arcs become
spherical sub-sections that appear to overlap when viewed from our
Solar System, obscuring the view of the arcs but not the general view
of the butterfly wings. ).
The resultant image appears as a butterfly structure composed of
narrow arcs, bearing a close resemblance to the morphology of a
number of axially symmetric, or butterfly nebulae (see
NGC 6302 in figure 4-3b, NGC-2346 in figure 4-3c and the Boomerang
Nebula in figure 4-3d).13
The width of the two outer lobes, or the wings of the
butterfly formation, is determined by the value of
.
The span of the two wings increases as
is reduced, becoming a full circle as
.
Reduction of the ordinary matter effect
will strengthen the butterfly morphology. However, increasing
by a factor larger than ten (in this example) may eliminate the
butterfly pattern, instead creating a pattern of concentric spheres
or circles. Note that for the case of a static or slow-rotating
nebula, the nebular structure is not reduced to a thin rotating disk
and retains substantial depth. Therefore, the minima arcs become
spherical sub-sections that appear to overlap when viewed from our
Solar System, obscuring the view of the arcs but not the general view
of the butterfly wings.
Figure 4-3a: Displays
the two dimensional map of the potential energy minima contours of an
ordinary particle of mass
as a function of its location in the galaxy plane  ,
calculated by applying equation 4-1-1a to a nebula with stationary or
low velocity SHP groups separated by the
distance ,
calculated by applying equation 4-1-1a to a nebula with stationary or
low velocity SHP groups separated by the
distance  from each other. The resulting morphology
resembles the general structure of the Bug Nebula NGC-6302, the
Butterfly Nebula NGC-2346 and the Boomerang
nebula shown in figures 4-3b, 4-3c and 4-3d respectively.
from each other. The resulting morphology
resembles the general structure of the Bug Nebula NGC-6302, the
Butterfly Nebula NGC-2346 and the Boomerang
nebula shown in figures 4-3b, 4-3c and 4-3d respectively.
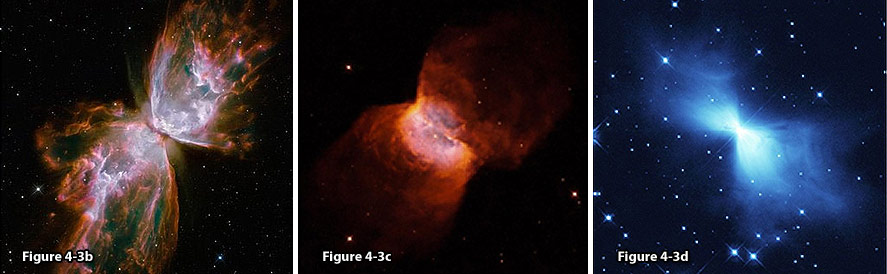
Figure
4-3b:
An image of NGC 6302,
or the Bug Nebula, taken by the refurbished Hubble Space Telescope,
shows a celestial object that looks like a delicate butterfly. The
image, provided by NASA,
was released Wednesday, Sept. 9, 2009 (AP Photo/NASA);http://nasa-satellites.blogspot.com/2009/09/excellent-images-from-refurbished.html.Figure
4-3c: NGC 2346, the
Butterfly Nebula, courtesy of Massimo Stiaelli (STScl) and NASA;
http://www.nasaimages.org/luna/servlet/detail/NVA2~4~4~7989~108515:NGC-2346--A-Butterfly-Shaped-Planet. Figure
4-3d:
A Hubble space telescope image of the Boomerang Nebula provided by
NASA;
http://www.spacetelescope.org/images/html/heic0301a.html.
Section IV-1-4:
Hourglass Structures
The same methodology can be applied toward producing the hourglass
structure observed in MyCn 18 (figure 4-4e), or at the center of the
Southern Crab Nebula (figure 4-4b). Such structure requires at least
two superheavy particle groups. The highly symmetrical structure of
the hourglass morphology suggests the existence of two dominant
groups of equal SHP mass. The value of
is more difficult to estimate, however the selection of
is a reasonable starting point. Equation 4-1-1b can be divided by
 without bearing any effect on the overall morphology, as the
potential energy minima will remain at the exact same locations as
long as
is also divided by
.
Therefore,
can be selected. Since
without bearing any effect on the overall morphology, as the
potential energy minima will remain at the exact same locations as
long as
is also divided by
.
Therefore,
can be selected. Since
 was shown to produce concentric spheres or circles, a larger distance
should be tested. Initially, we can arbitrarily select values of
was shown to produce concentric spheres or circles, a larger distance
should be tested. Initially, we can arbitrarily select values of
 and
and
 and then apply the first scaling theorem of the UG theory for
correction.14
Comparing the two dimensional maps generated by different values of
with the desired morphology provides a relatively good fit at
and then apply the first scaling theorem of the UG theory for
correction.14
Comparing the two dimensional maps generated by different values of
with the desired morphology provides a relatively good fit at
 .
The resultant map in figure 4-4a demonstrates a close resemblance to
the central section of the Southern Crab Nebula in the constellation
of Centaurus. Plotting the concentric equi-potential minima contours
of the two SHP groups provides vivid insight into how such a pattern
is formed at the intersections of the various minima contours. Note
that finding the right value of
is not difficult since the general hourglass structure appears within
a wide range of
values, and can easily be fined-tuned via trial and error to generate
the desired
- .
The resultant map in figure 4-4a demonstrates a close resemblance to
the central section of the Southern Crab Nebula in the constellation
of Centaurus. Plotting the concentric equi-potential minima contours
of the two SHP groups provides vivid insight into how such a pattern
is formed at the intersections of the various minima contours. Note
that finding the right value of
is not difficult since the general hourglass structure appears within
a wide range of
values, and can easily be fined-tuned via trial and error to generate
the desired
- proportions. Using the above parameters results in a galactic-scale
radius of
proportions. Using the above parameters results in a galactic-scale
radius of
 ,
which is about 111,000 times larger than the desired dimensions of a
nebula of roughly ,
which is about 111,000 times larger than the desired dimensions of a
nebula of roughly
 .
With the aid of the first scaling theorem of the UG theory, the
transformation of .
With the aid of the first scaling theorem of the UG theory, the
transformation of
 , ,
 and
and
 will provide the exact same morphology in the typical scale of
planetary nebulae.15
MyCn 18 (figure 4-4e), known as the Engraved Hourglass nebula,
provides a similar bipolar morphology, but differs in two important
aspects: First, the dramatic, bright central core observed at the
center of the Hourglass nebula does not appear in the calculated
model of figure 4-4a. In addition, the two sets of concentric
circles are observed to overlap significantly, rather than simply
intersecting at a single point at the center (as is the case in
figures 4-4a and 4-4b). The results obtained by applying the
scaled-down parameters
will provide the exact same morphology in the typical scale of
planetary nebulae.15
MyCn 18 (figure 4-4e), known as the Engraved Hourglass nebula,
provides a similar bipolar morphology, but differs in two important
aspects: First, the dramatic, bright central core observed at the
center of the Hourglass nebula does not appear in the calculated
model of figure 4-4a. In addition, the two sets of concentric
circles are observed to overlap significantly, rather than simply
intersecting at a single point at the center (as is the case in
figures 4-4a and 4-4b). The results obtained by applying the
scaled-down parameters
 and and
 using a potential energy cut-off of
 and adding into the equation the contribution of ordinary matter
of and adding into the equation the contribution of ordinary matter
of
 at the center of the nebula are presented in figure 4-4c. The
resultant object is of the size of a typical nebula, and retains its
general morphology beyond the central area of the structure. The
addition of a large mass of ordinary matter at the center of the
galaxy produces a strong gravitational pull inward towards the
center. The gravitational pull is especially robust at low radii,
resulting in the formation of a circular bulge at the galactic core,
where the size of the central bulge increases with the amount of
ordinary matter near the center of the galaxy. at the center of the nebula are presented in figure 4-4c. The
resultant object is of the size of a typical nebula, and retains its
general morphology beyond the central area of the structure. The
addition of a large mass of ordinary matter at the center of the
galaxy produces a strong gravitational pull inward towards the
center. The gravitational pull is especially robust at low radii,
resulting in the formation of a circular bulge at the galactic core,
where the size of the central bulge increases with the amount of
ordinary matter near the center of the galaxy.
Figure
4-4a: Demonstrates an
hourglass morphology
generated by two stationary single-particle SHP
groups of SHP mass  ,
where the SHP velocity ,
where the SHP velocity  ,
and the distance between the SHP
groups and
center of rotation is approximately ,
and the distance between the SHP
groups and
center of rotation is approximately  .
The calculated pattern bears a close resemblance to the center of
the Southern Crab
Nebula,
displayed in figure 4-4b. Also shown are the
two identical sets of concentric minima contours produced by group 1
(green) and group 2 (cyan), which are displaced by a distance of .
The calculated pattern bears a close resemblance to the center of
the Southern Crab
Nebula,
displayed in figure 4-4b. Also shown are the
two identical sets of concentric minima contours produced by group 1
(green) and group 2 (cyan), which are displaced by a distance of  The overall potential energy minima are given by the intersections
between the two sets of minima contours respectively generated by
each of the two SHP
groups, and are indicated in blue. Note that the calculated
morphology depicts an additional set of arcs along the galaxys
axis of symmetry (the
The overall potential energy minima are given by the intersections
between the two sets of minima contours respectively generated by
each of the two SHP
groups, and are indicated in blue. Note that the calculated
morphology depicts an additional set of arcs along the galaxys
axis of symmetry (the  axis) that were not detected in the observed images (these two
additional calculated arcs provide spiral arms
in cases of rapidly rotating SHP
groups).
axis) that were not detected in the observed images (these two
additional calculated arcs provide spiral arms
in cases of rapidly rotating SHP
groups).
To resolve the lack of overlap between the two sets of contours
generated by the two SHP groups in the modeled galaxy (relative to
the observed image of MyCn 18), a greater distance value can be used.
Figure 4-4d demonstrates that the relatively large overlapping area
between the two sets of circular contours in MyCn 18 may be generated
by introducing a much larger distance
 .
Application of this value, using .
Application of this value, using
 , ,
 ,
,
and ,
,
and
 provides two sets of concentric overlapping contours, as well as a
central accumulation of matter, resulting in an almost identical
morphology to the Hourglass nebula.
provides two sets of concentric overlapping contours, as well as a
central accumulation of matter, resulting in an almost identical
morphology to the Hourglass nebula.
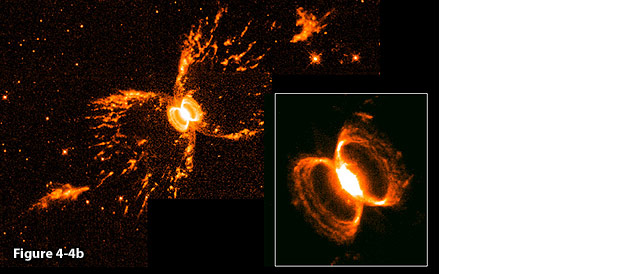
Figure
4-4b: The Southern
Crab Nebula, image credit:
Romano Corradi Instituto de Astrofisica de Canarias, Tenerife, Spain,
Mario Livio, Space Telescope Science Institute, Baltimore, MD, Ulisse
Munari, Osservatorio Astronomico Di Padova-Asiago, Italy, Hugo
Schwarz Nordic Optical Telescope Canarias Spain, and NASA.
Figure
4-4c: Scaling down by
a factor of about  and adding the contribution of
  of ordinary matter at the center of the structure provides the
dimensions of a typical nebula, and an internal central bulge
similar to the center of the hourglass nebula
shown in figure 4-4e.
of ordinary matter at the center of the structure provides the
dimensions of a typical nebula, and an internal central bulge
similar to the center of the hourglass nebula
shown in figure 4-4e.
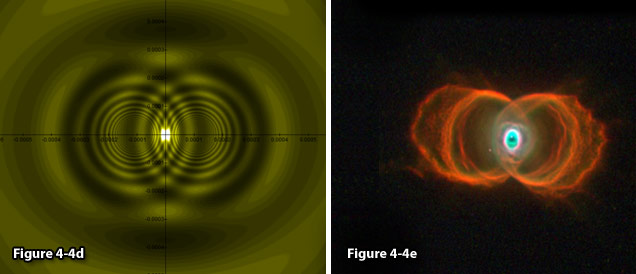
Figure
4-4d:
Demonstrates a calculated hourglass morphology
generated by two stationary single-particle SHP
groups of SHP
mass  ,
where the SHP
velocity ,
the distance between the SHP
groups and
their common center of mass ,
where the SHP
velocity ,
the distance between the SHP
groups and
their common center of mass  ,
and the overall mass of ordinary matter ,
and the overall mass of ordinary matter  .
The calculated pattern bears a significant resemblance to the center
of the Hourglass
nebula
MyCn 18displayed
in figure 4-4e. .
The calculated pattern bears a significant resemblance to the center
of the Hourglass
nebula
MyCn 18displayed
in figure 4-4e. Figure
4-4e: The Hourglass
Nebula, MyCn 18. Image
credit: R. Sahai and J.
Trauger, Photo AURA/STScl/NASA/JPL
(NASA photo # STScl-PRC96-07);
http://apod.nasa.gov/apod/ap020615.html.
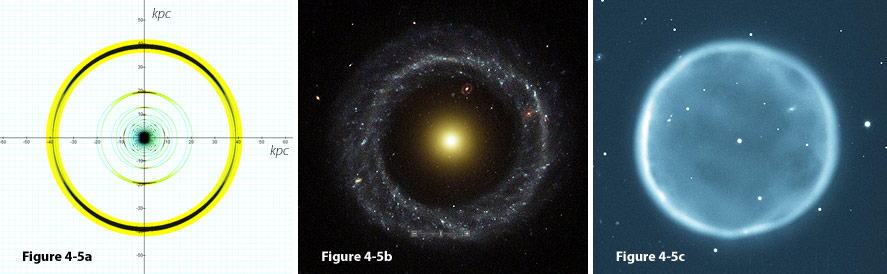
Figure
4-5a: Displays a two
dimensional map of the potential energy contours of an ordinary
particle of mass
as function of its location in the galactic disk
for a galaxy similar to the one used in figure 4-4a, using a
superheavy particle of mass  .
The black contours include the lowest minima regions, where .
The black contours include the lowest minima regions, where  ,
while the yellow contours provide the range where ,
while the yellow contours provide the range where  Ordinary matter is expected to concentrate at the minima contours
(mainly at the black contours, and to a lesser degree at the yellow
contours), resulting in a ring morphology.
Also displayed are the circular minima contours of the potential
energy contribution of each of the two SHP
groups (in green and cyan). Note the resemblance to the planetary
nebula Abell 39 in figure
4-5c and to Hoags object in figure 4-5b. The following
parameters were used: ,
,
,
and
Ordinary matter is expected to concentrate at the minima contours
(mainly at the black contours, and to a lesser degree at the yellow
contours), resulting in a ring morphology.
Also displayed are the circular minima contours of the potential
energy contribution of each of the two SHP
groups (in green and cyan). Note the resemblance to the planetary
nebula Abell 39 in figure
4-5c and to Hoags object in figure 4-5b. The following
parameters were used: ,
,
,
and  . . Figure
4-5b: Image credit:
NASA
and the Hubble Heritage Team (STScI/AURA) Acknowledgment: R.
Lucas(STScI/AURA)
http://www.nasaimages.org/luna/servlet/detail/NVA2~4~4~4753~105279:Hoag-s-Object--A-Strange-Ring-Galaxy. Figure
4-5c: The Planetary Nebula Abell 39,
WIYN
Observatorys 3.5-m (138-inch) telescope at Kitt Peak National
Observatory, Tucson, AZ, image credit: NOAO/AURA/NSF.
Section IV-1-5: Ring Morphologies in Galaxies and
Nebulae
Figure 4-5a depicts
a similar galaxy of SHP mass
 and orbital radius
 ,
viewed in a substantially increased display threshold using two
cut-off energy levels ,
viewed in a substantially increased display threshold using two
cut-off energy levels
 and
and
 to show only the vicinity of the minima (where darker color values
indicate lower potential energy). The resultant morphology
transforms into a ring structure, bearing a resemblance to a number
of galactic systems with external rings, such as Hoags Object
in figure 4-5b (Hoag, 1950), as well as NGC 6028
(Vorontsov-Velyaminov, 1959), NGC 2859 (Sandage,
1961), UGC 9562 and NGC 3081. The model may be scaled down to
the dimensions of a typical nebula (via the first scaling theorem of
the UG theory given in Appendix A) to explain the structure of ring
nebulae such as Abell 39 in figure 4-5c.
to show only the vicinity of the minima (where darker color values
indicate lower potential energy). The resultant morphology
transforms into a ring structure, bearing a resemblance to a number
of galactic systems with external rings, such as Hoags Object
in figure 4-5b (Hoag, 1950), as well as NGC 6028
(Vorontsov-Velyaminov, 1959), NGC 2859 (Sandage,
1961), UGC 9562 and NGC 3081. The model may be scaled down to
the dimensions of a typical nebula (via the first scaling theorem of
the UG theory given in Appendix A) to explain the structure of ring
nebulae such as Abell 39 in figure 4-5c.
Section
IV-2: The Influence of SHP Group Rotation
on Morphology and the Creation of Spiral
Galaxies
Section IV-2-1: The
Creation of Spiral Structures via Two Non-Relativistic Rotating SHP
groups
The morphology of galaxies can be sorted into four main categories
according to the Hubble Classification System, dividing regular
galaxies into three broad classes- elliptical, spiral and lenticular
galaxies, as well as a fourth class of galaxies with an irregular
appearance.16
The Hubble sequence shows significant variation even within its
broad morphological classes, and the transitions between them are
relatively smooth. Thus, classification provides only an approximate
procedure, where two skilled astronomers may arrive at two different
classifications for the same galaxy.
Among the morphological classes, spiral galaxies have proven to be
particularly intriguing and challenging, as understanding their
evolution andthe variation among their
local properties has shown to be one of the more complex undertakings
in astrophysics. Drawing on earlier work by Bertil Lindblad, C.C.
Lin and Frank Shu suggested that the spiral pattern can be viewed as
a manifestation of low-amplitude density waves that
rotate throughout the galaxy with fixed angular speed called pattern
speed, causing a periodic compression and rarefaction of the disk
surface (Lin & Shu,1964). As
the compression wave rotates, it triggers star formation on the
leading edge of the spiral arms. Lin and Shu also assumed that in
the large-scale spiral structure, the appearance of spiral arms
remains stable over many orbital periods.17
At present, near-infrared images of nearby galaxies have provided
convincing evidence that the large-scale spiral structure is a
density wave. However, emerging theories suggest that the spiral
pattern is far from stationary, and that spiral structure may result
from a wide variety of causes. The study of the dynamics of
differentially rotating disks has since developed into an extensive
density wave theory. The theory has achieved relative success in
explaining how spiral patterns can persist for a greater length of
time than the particular arms we see at a given moment, leading to a
semi-empirical approach for modeling different spiral morphologies.
Other theories suggest that the formation and evolution of spirals,
as well as a broad range of galactic morphologies, can be explained
via gravitational encounters or collisions between galaxies.
Nevertheless, in their book Galactic Dynamics, James Binney and Scott
Tremaine stated The number of reviews of spiral-structure
theory is disappointingly small (Binney & Tremaine,
2008). While observations provide persuasive evidence of the
existence of density waves, the exact nature of the density wave is
not yet well-understood and the number of galaxies successfully
modeled (quantitatively) is small. By means of the UG
theory, spiral morphology can be generated by the interaction between
a test object and two (or more) SHP groups rotating at
non-relativistic speeds of
 ,
or by a single (or more than one) SHP group rotating at a
relativistic speed. ,
or by a single (or more than one) SHP group rotating at a
relativistic speed. According
to equation 4-1-1a, the size and morphology of a galaxy depends on
the mass of its dominant superheavy particles, the rotational
velocity of the SHP groups, and their radii of orbit around the
center of the galaxy. The mass of superheavy particles in equation
4-1-1a affects the potential energy amplitude through the term
 ,
and the size of the galactic disk through the term ,
and the size of the galactic disk through the term
 .
Note that the SHP contribution to the objects potential
energy increases its potential energy amplitude by a factor of .
Note that the SHP contribution to the objects potential
energy increases its potential energy amplitude by a factor of
 .
Therefore, the rotational velocity of the SHP groups increases the
effective size of the galaxy by a factor between .
Therefore, the rotational velocity of the SHP groups increases the
effective size of the galaxy by a factor between (in the direction perpendicular to the direction of the velocity of
the SHP group) and
(in the direction parallel to the direction of the SHP velocity).18
The farthest substantial zonal minimum from the center is located at
(in the direction perpendicular to the direction of the velocity of
the SHP group) and
(in the direction parallel to the direction of the SHP velocity).18
The farthest substantial zonal minimum from the center is located at
 in the relativistic case (which is reduced to
 in the non-relativistic case). The farthest substantial minimum
provides the distance of the last significant outer contour (or
isophote) containing a high density of matter,19
and therefore defines the visible edge of the galaxy, or the galactic
disk radius. In figures 4-1 to 4-5, the morphology appears to be far
more sensitive to the radius
of the SHP group(s) than to changes in the number of SHPs within the
SHP group(s), or to changes in the SHP mass (at least for the case of
a single dominant SHP).
in the non-relativistic case). The farthest substantial minimum
provides the distance of the last significant outer contour (or
isophote) containing a high density of matter,19
and therefore defines the visible edge of the galaxy, or the galactic
disk radius. In figures 4-1 to 4-5, the morphology appears to be far
more sensitive to the radius
of the SHP group(s) than to changes in the number of SHPs within the
SHP group(s), or to changes in the SHP mass (at least for the case of
a single dominant SHP). Recall that as a
cloud of gas collapses inward under its own gravitational force to
form a galaxy, the law of conservation of angular momentum dictates
that its rotation must accelerate as it becomes more and more
compressed. According to the UG postulates, the extreme conditions
generated by the collapse lead to the creation of massive superheavy
particles. As of equation 3-3-1, the velocity of SHP groups is
proportional to their radius of orbit, and may therefore be
relativistic.
In the case of two
stationary or very slow rotating binary SHP groups, an hourglass
pattern similar to the observed nebula MyCn 18, or to the center of
the Southern Crab nebula, can be generated at distances
not much larger than the order of
.
As the distance between the SHP group and the object increases well
beyond
,
the morphology begins to change into a butterfly pattern, and
eventually forms a concentric ring structure at
 ,
where the distance separating two successive rings increases with
their distance from the SHP groups. ,
where the distance separating two successive rings increases with
their distance from the SHP groups.
The
rotation of SHP groups will be shown to result in the formation of
spiral structures. The mechanism responsible for the creation of
spirals at low velocities differs from the mechanism responsible for
the creation of spirals at relativistic velocities. At low
rotational speeds, a minimum of two SHP groups are necessary in order
to create a spiral structure. In the relativistic case, however, due
to the effect of relativistic distance contraction in the direction
parallel to the direction of the SHP velocity, and to the lack of
relativistic contraction in the perpendicular directions, even a
single SHP group may be sufficient to produce spiral morphology.
We begin with the non-relativistic case. Figure 4-6 displays a two
dimensional map of the potential energy minima contours of an object
composed of a single ordinary test particle of mass
as a function of its location within the galactic disk plane. The
provided galaxy contains two SHP groups of SHP mass
 traveling at a velocity of
 at a radius of
 ,
where
and ,
where
and
 .
The minima contours of the overall potential energy were again
calculated via equation 4-1-1a, and the display provides the regions
where the test particles potential energy complies with .
The minima contours of the overall potential energy were again
calculated via equation 4-1-1a, and the display provides the regions
where the test particles potential energy complies with
 .
The particles potential energy minima, indicated in black,
are shown to be located at the intersections of the minima contours
of the two SHP groups, indicated in cyan and green respectively. The
figure demonstrates a clear spiral structure at the central part of
the galaxy. The spiral arms are constructed from arcs, which appear
relatively short near the galaxy center and grow longer as the test
particles distance from the center increases. .
The particles potential energy minima, indicated in black,
are shown to be located at the intersections of the minima contours
of the two SHP groups, indicated in cyan and green respectively. The
figure demonstrates a clear spiral structure at the central part of
the galaxy. The spiral arms are constructed from arcs, which appear
relatively short near the galaxy center and grow longer as the test
particles distance from the center increases.
The mechanism at work to produce the spiral structure at
non-relativistic velocities requires at least two SHP groups, where
each group generates a set of concentric minima around itself.
Equation 4-1-1a provides minima at the coordinates at which the two
cosine terms are either equal to or very close to
.
At these locations a circular minimum contour produced by a single
SHP group (in cyan) coincides with a circular minimum contour
produced by the other SHP group, forming a set of arcs at and near
their intersection points. As the distance between the minimum
intersections and the central SHP groups increases, a greater amount
of time is required for the gravitational signal traveling at a
relativistic velocity
to arrive. This lengthens the distance traveled by the two SHP
groups between the time(s) that the gravitational signals (or
gravitons) were emitted, as well as the time of their simultaneous
interception by the orbiting object. Consequently, the arcs that are
farther away from the galaxy center will lag behind those closer to
the center, in effect creating a spiral pattern.
Figure
4-6: Depicts the
contours that fulfill equation 4-1-1a, where both SHP
groups rotate at a non-relativistic speed of  A clear spiral structure appears at the central part of the galaxy,
created at the intersection points of the two sets of concentric
circular contours generated by the two rotating SHP
groups.
A clear spiral structure appears at the central part of the galaxy,
created at the intersection points of the two sets of concentric
circular contours generated by the two rotating SHP
groups.
The complete mathematical formulation leading to the spiral is given
by equations 4-1-1a, 3-1-17a, 3-1-17b and 3-1-20. The following
explanation, while making some approximations, can make these
mathematical results somewhat more intuitive. Following
equation 2-1-12, the radii of a set of potential energy minima
generated by a stationary SHP group can be approximated by
 (for
,
(for
,
 , ,
 ).
A second factor affecting the minima locations is the displacement
of the SHPs during the finite time it takes the gravitational signal
to reach the orbiting ordinary particle. This results in different
sections of spacetime being affected by the gravitational pull
created by the SHP groups at different times and different locations.
For the case where the speed of SHP groups is small relative to the
speed of light, or
).
A second factor affecting the minima locations is the displacement
of the SHPs during the finite time it takes the gravitational signal
to reach the orbiting ordinary particle. This results in different
sections of spacetime being affected by the gravitational pull
created by the SHP groups at different times and different locations.
For the case where the speed of SHP groups is small relative to the
speed of light, or
 ,
the difference in the amount of time it takes the gravitational
signal to propagate between the two successive minima contours
indexed ,
the difference in the amount of time it takes the gravitational
signal to propagate between the two successive minima contours
indexed
 and
and
 is
is
 ,
in which time the two SHP groups were displaced by the angle of ,
in which time the two SHP groups were displaced by the angle of
 .
Therefore, as long as .
Therefore, as long as
 and and
 ,
the effect of the SHP group rotation is negligible, and a standard
hourglass morphology will result. When ,
the effect of the SHP group rotation is negligible, and a standard
hourglass morphology will result. When
 becomes more substantial, but still significantly smaller than
 (for example,
 ),
the small angular displacement between the successive minima contours
creates a clear spiral structure. At larger distances of ),
the small angular displacement between the successive minima contours
creates a clear spiral structure. At larger distances of
 ,
where
is very small compared with
,
the pattern displays both ring and spiral morphology. At distances
where ,
where
is very small compared with
,
the pattern displays both ring and spiral morphology. At distances
where
 ,
the pattern becomes a ring galaxy (as long as the relative influence
of the galaxys ordinary matter is sufficiently small).
Therefore, a galaxy (of non-relativistic SHP velocities) may contain
at least one outer ring, as well as an inner spiral structure located
between the central core and the outer ring. Such morphology may
occur when ,
the pattern becomes a ring galaxy (as long as the relative influence
of the galaxys ordinary matter is sufficiently small).
Therefore, a galaxy (of non-relativistic SHP velocities) may contain
at least one outer ring, as well as an inner spiral structure located
between the central core and the outer ring. Such morphology may
occur when
 and
and
 ,
and is observed in M31 the Andromeda galaxy. However, the relative
effect of the galaxys ordinary matter may be sufficiently
large to eliminate the outer rings. ,
and is observed in M31 the Andromeda galaxy. However, the relative
effect of the galaxys ordinary matter may be sufficiently
large to eliminate the outer rings.
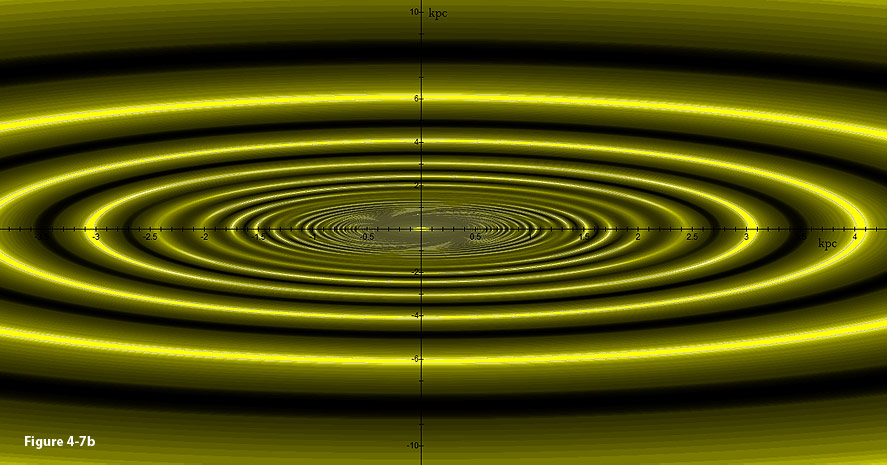
The results of
substituting the values
,
,
 , ,
 and
and
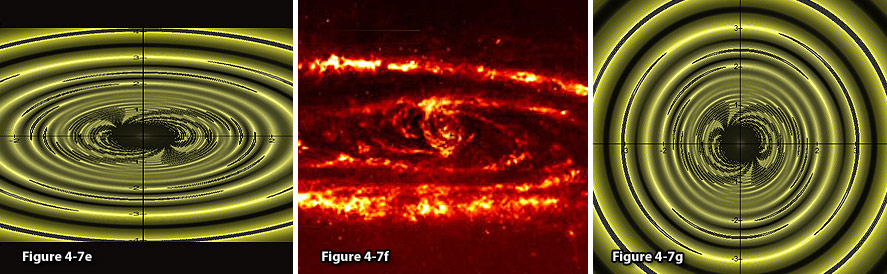
 into equation 4-1-1a are depicted in figure 4-7a, providing a
structure that bears a resemblance to a smoothed version of the
Andromeda galaxy. The modeled galaxy, viewed in face-on orientation,
displays a central hourglass structure (which appears slightly
distorted by the rotation of the central SHP groups) and a series of
rings, where the most prominent outer rings (bright minima of
,
and
)
are located at about
into equation 4-1-1a are depicted in figure 4-7a, providing a
structure that bears a resemblance to a smoothed version of the
Andromeda galaxy. The modeled galaxy, viewed in face-on orientation,
displays a central hourglass structure (which appears slightly
distorted by the rotation of the central SHP groups) and a series of
rings, where the most prominent outer rings (bright minima of
,
and
)
are located at about
 , ,
 and
and
 ,
as well as a more diffused inner structure. A tilted version of the
computed galaxy is displayed in figure 4-7b. The model also depicts
two trailing spiral arms in between the central bulge and the ring at
(see the enlarged view in figure 4-7g). These features of the
modeled galaxy fit well with the properties demonstrated by the
Andromeda galaxy in figures 4-7c and 4-7f, which depict two tightly
wound trailing spiral arms that extend outward and transition into a
ring galaxy between ,
as well as a more diffused inner structure. A tilted version of the
computed galaxy is displayed in figure 4-7b. The model also depicts
two trailing spiral arms in between the central bulge and the ring at
(see the enlarged view in figure 4-7g). These features of the
modeled galaxy fit well with the properties demonstrated by the
Andromeda galaxy in figures 4-7c and 4-7f, which depict two tightly
wound trailing spiral arms that extend outward and transition into a
ring galaxy between
 and
.
The rotating hourglass structure at the center of the modeled galaxy
(figure 4-7g) also bears a resemblance to the general structure of
Andromedas nucleus (figure 4-7f), additionally accounting for
the ansae reported by Beaton et al. in 2007 (Beaton et al.,
2007). Note that the model predicts the existence of virtually
an infinite number of ansae, which may be perceived as a single ansa
on each side when viewed in insufficient resolution. and
.
The rotating hourglass structure at the center of the modeled galaxy
(figure 4-7g) also bears a resemblance to the general structure of
Andromedas nucleus (figure 4-7f), additionally accounting for
the ansae reported by Beaton et al. in 2007 (Beaton et al.,
2007). Note that the model predicts the existence of virtually
an infinite number of ansae, which may be perceived as a single ansa
on each side when viewed in insufficient resolution.
Figure
4-7a: Substituting
 , ,
 , ,
 , , and
and  into equation 4-1-1a provides a face-on view of a series of rings,
where the most prominent outer rings (bright minima of
into equation 4-1-1a provides a face-on view of a series of rings,
where the most prominent outer rings (bright minima of  , ,
 and
and  )
are located at about )
are located at about  , ,
 and
and  ,
as well as a central hourglass structure that is slightly distorted
by the rotation of the central SHP
groups. The resultant structure bears a significant resemblance to a
smoothed version of the Andromeda
galaxy (see figure 4-7c).
Note that the lowest few energy contours were displayed in black to
increase the contrast between the central disk and the surrounding
environment. ,
as well as a central hourglass structure that is slightly distorted
by the rotation of the central SHP
groups. The resultant structure bears a significant resemblance to a
smoothed version of the Andromeda
galaxy (see figure 4-7c).
Note that the lowest few energy contours were displayed in black to
increase the contrast between the central disk and the surrounding
environment.
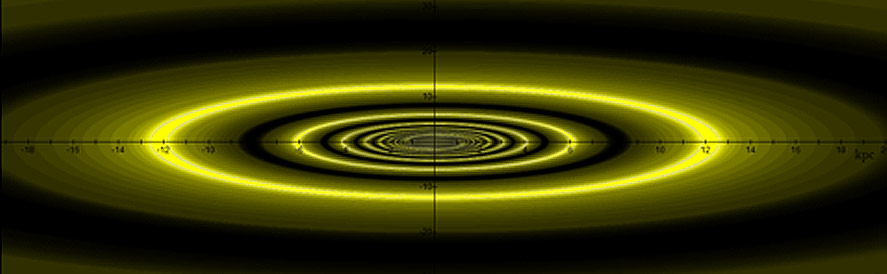
Figure
4-7b: Display of the
same modeled galaxy tilted at nearly  around the
axis.
around the
axis.
Note
that this simple model does not take into account the influence of
Andromedas companion galaxy M32 on its morphology. A companion
galaxy will be shown to explain distortions in the ring or spiral
structures of galaxies such as Andromeda, as well as the appearance
of beads on a string. The influence of a companion
galaxy on galactic systems will be demonstrated in section IV-4.
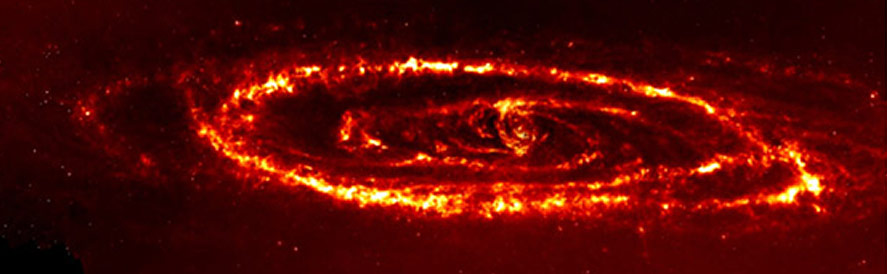
Figure
4-7c: An infrared view
taken by NASAs
Spitzer
Space Telescope
revealed a dust ring deep within the Andromeda
galaxy. Combined with
previous data of an outer ring, the image was interpreted as evidence
that the neighboring dwarf galaxy M32 collided with the Andromeda
Galaxy about 210 million
years ago, plunging through its central disk. According to the UG
theory, Andromedas rings are a direct consequence of equation
4-1-1a, while the appearance of beads on a string and
the split of the outer
rings are due to the gravitational effect of a companion galaxy (see
section IV-5). Image
credit: NASA/JPL-Caltech/K.
Gordon (University of Arizona,
http://www.spitzer.caltech.edu/Media/releases/ssc2005-20/ssc2005-20a.shtml.
Figure
4-7d: Provides a
direct comparison between the calculated galaxy of figures 4-7b and
the observed image in figure 4-7c.
Figure
4-7e: Provides the
tilted version of the calculated image of the center of the
Andromeda galaxy.
Note the ansae and two
spiral arms displayed at
the central bulge and the
similarities between the calculated image in figure 4-7e and the
observed center of Andromeda in figure 4-7f. Figure
4-7f: A view of the
center of figure 4-7c. Figure
4-7g:Provides a clear
view of the calculated central disk of the modeled galaxy. Note the
appearance of ansae, as
well as two short tightly wound trailing spiral arms
extend outward and transition into a ring galaxy between  and .
The lowest few energy contours are depicted in black to increase the
display contrast between the central disk and the surrounding
environment.
and .
The lowest few energy contours are depicted in black to increase the
display contrast between the central disk and the surrounding
environment.
Section IV-2-2:
Relativistic Rotational Speeds of SHP Groups and the Creation
of the Grand Design Spiral Morphology
Accounting
for the morphologies of certain grand design and flocculent spiral
structures may require relativistic SHP velocities. Some examples
are shown in figures 4-8a to 4-8k. Figure 4-8a depicts a two
dimensional map of the potential energy contours of an ordinary
particle of mass
within the rotation plane of a galaxy generated by identical binary
SHP groups
 ,
each containing a single SHP of mass ,
each containing a single SHP of mass
 ,
traveling at a constant velocity ,
traveling at a constant velocity
 (which translates to an angular velocity of
 )
in a circular orbit of radius
around the galaxy center. The influence of the galaxys
remaining ordinary matter )
in a circular orbit of radius
around the galaxy center. The influence of the galaxys
remaining ordinary matter
 is initially neglected. The resultant minima resemble slightly
distorted elliptical (almost circular) isophotes of
various sizes and orientations. These contours change smoothly in
accordance with the distance of the ordinary particle from the
galactic center, creating rings and arcs at the minima and relative
voids at the maxima, as well as a slightly distorted or twisted
hourglass pattern at the center of the galaxy. Figure 4-8b
displays the minima contours of the potential energy of an ordinary
particle within the galaxys rotation plane using a similar
scenario, where the speed of the SHP groups is increased to
is initially neglected. The resultant minima resemble slightly
distorted elliptical (almost circular) isophotes of
various sizes and orientations. These contours change smoothly in
accordance with the distance of the ordinary particle from the
galactic center, creating rings and arcs at the minima and relative
voids at the maxima, as well as a slightly distorted or twisted
hourglass pattern at the center of the galaxy. Figure 4-8b
displays the minima contours of the potential energy of an ordinary
particle within the galaxys rotation plane using a similar
scenario, where the speed of the SHP groups is increased to
 .
This increase in rotational velocity can be observed to result in a
significant distortion of the morphology of the potential energy
contours. Applying the same parameters, figure 4-8c demonstrates the
asymmetry produced by the influence of a single SHP group, or
,
rather than binary superheavy particles. Note that in the case of a
single SHP group, the lack of intersection between different minima
contours prevents the generation of a massive amount of stars. If
such structures exist, they should appear as asymmetric galaxies
containing little or no stars.20 .
This increase in rotational velocity can be observed to result in a
significant distortion of the morphology of the potential energy
contours. Applying the same parameters, figure 4-8c demonstrates the
asymmetry produced by the influence of a single SHP group, or
,
rather than binary superheavy particles. Note that in the case of a
single SHP group, the lack of intersection between different minima
contours prevents the generation of a massive amount of stars. If
such structures exist, they should appear as asymmetric galaxies
containing little or no stars.20
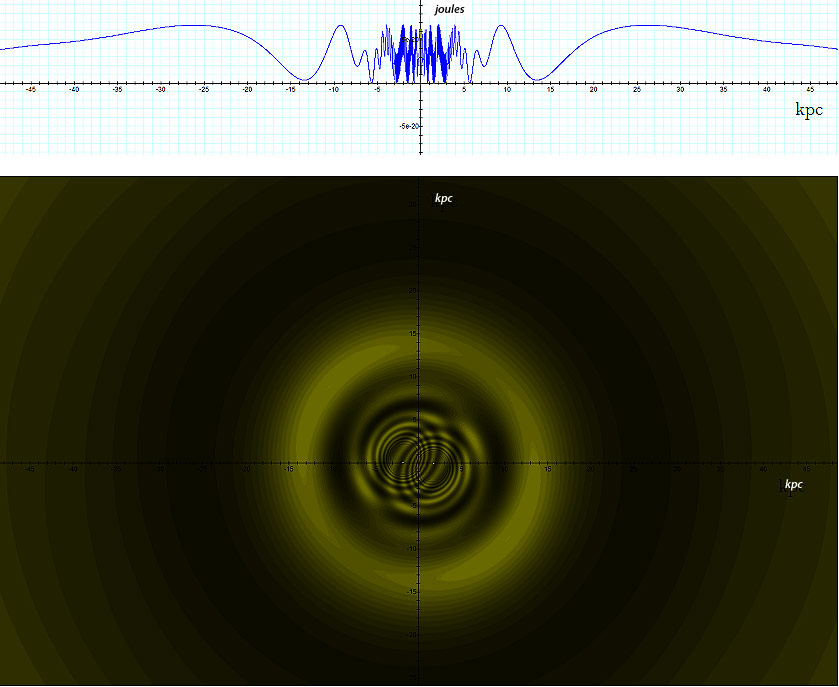
Figure 4-8a: The lower
image provides the two dimensional color map of
the calculated potential energy of an ordinary particle of mass
as a function of its location ,
substituting ,
  , ,
 ,
,
, ,
,
,
 .
The upper curve provides the potential energy along the
axis. The resultant minima contours resemble slightly distorted
elliptical (almost circular) isophotes of
various sizes and orientations. These contours change smoothly in
accordance with the distance of the ordinary particle from the galaxy
center, creating rings and arcs at the minima (the brightest
contours) and relative voids at the maxima (at the darkest contours)
as well as a slightly distorted hourglass pattern at the center of
the galaxy. .
The upper curve provides the potential energy along the
axis. The resultant minima contours resemble slightly distorted
elliptical (almost circular) isophotes of
various sizes and orientations. These contours change smoothly in
accordance with the distance of the ordinary particle from the galaxy
center, creating rings and arcs at the minima (the brightest
contours) and relative voids at the maxima (at the darkest contours)
as well as a slightly distorted hourglass pattern at the center of
the galaxy.
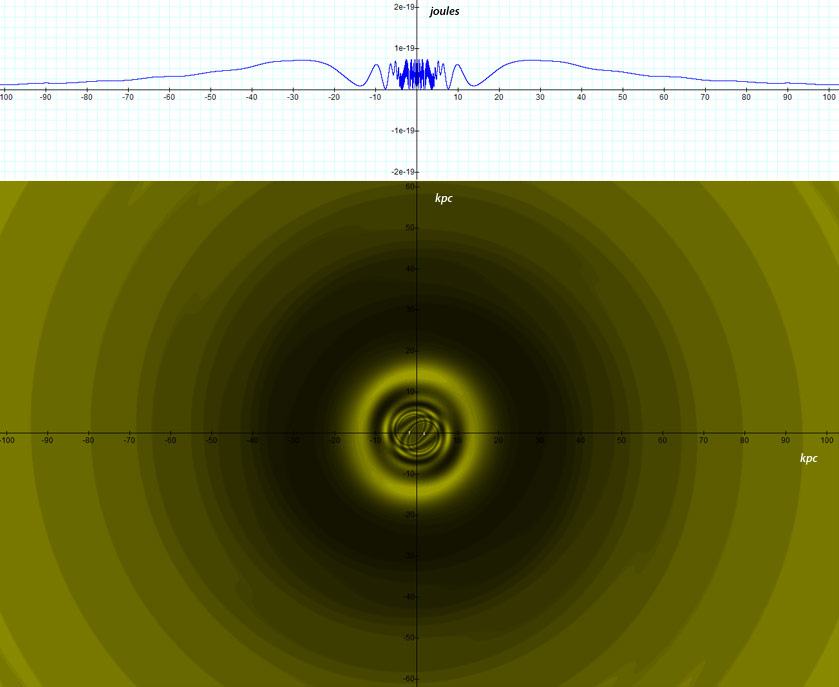
Figure
4-8b: Displays a
galaxy generated using the same parameters as figure 4-8a, where  is increased to
  .
Note that a decreased display resolution is used. .
Note that a decreased display resolution is used.
Note
that the isophote patterns in figures 4-8a and 4-8b are still
approximately circular and do not yet provide a spiral structure.
However, when the SHP velocity is increased to
 ,
as shown in Figure 4-8d, the potential energy of the galactic disk
begins to form into a spiral structure with two trailing arms, and
the hourglass morphology at the center of the galaxy begins to shift
into a bar-like structure. It is generally quite difficult to
determine simply by observation whether a spiral arm is leading or
trailing. However, in almost all cases where the result is
unambiguous, the spiral arms are found to be trailing. This can be
expected according to the UG explanation. The underlying reason for
the formation of the spiral morphology is that it takes longer for
the gravitational signal to reach the farthest sections of the spiral
arms than to the sections located closer to the galaxy center. The
farthest sections of the spiral are thus influenced by earlier
locations of the SHP groups, and therefore lag behind their
counterparts at the inner portion of the same spiral. Consequently,
the outer edge of a spiral arm should be trailing, while the inner
edge should be leading.21
Increasing the velocity of the SHP group to ,
as shown in Figure 4-8d, the potential energy of the galactic disk
begins to form into a spiral structure with two trailing arms, and
the hourglass morphology at the center of the galaxy begins to shift
into a bar-like structure. It is generally quite difficult to
determine simply by observation whether a spiral arm is leading or
trailing. However, in almost all cases where the result is
unambiguous, the spiral arms are found to be trailing. This can be
expected according to the UG explanation. The underlying reason for
the formation of the spiral morphology is that it takes longer for
the gravitational signal to reach the farthest sections of the spiral
arms than to the sections located closer to the galaxy center. The
farthest sections of the spiral are thus influenced by earlier
locations of the SHP groups, and therefore lag behind their
counterparts at the inner portion of the same spiral. Consequently,
the outer edge of a spiral arm should be trailing, while the inner
edge should be leading.21
Increasing the velocity of the SHP group to
 and
and
 strengthens the spiral structure. As displayed in figures 4-8e and
4-8g, the spiral becomes tighter, further defining the central bar.
strengthens the spiral structure. As displayed in figures 4-8e and
4-8g, the spiral becomes tighter, further defining the central bar.
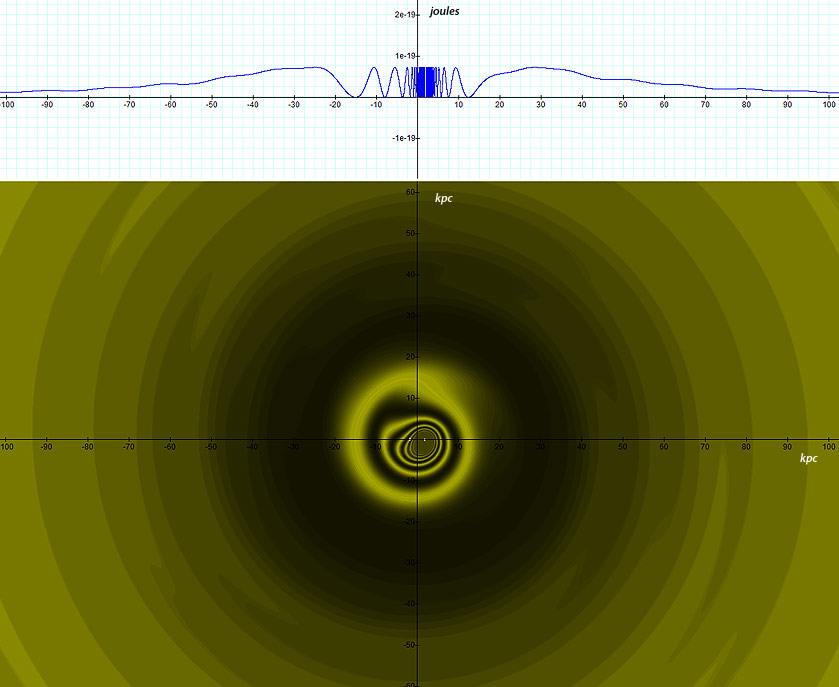 
Figure 4-8c: Depicts a
galaxy generated via the same parameters as figure 4-8b with only a
single superheavy particle  ,
producing clear asymmetry. ,
producing clear asymmetry.
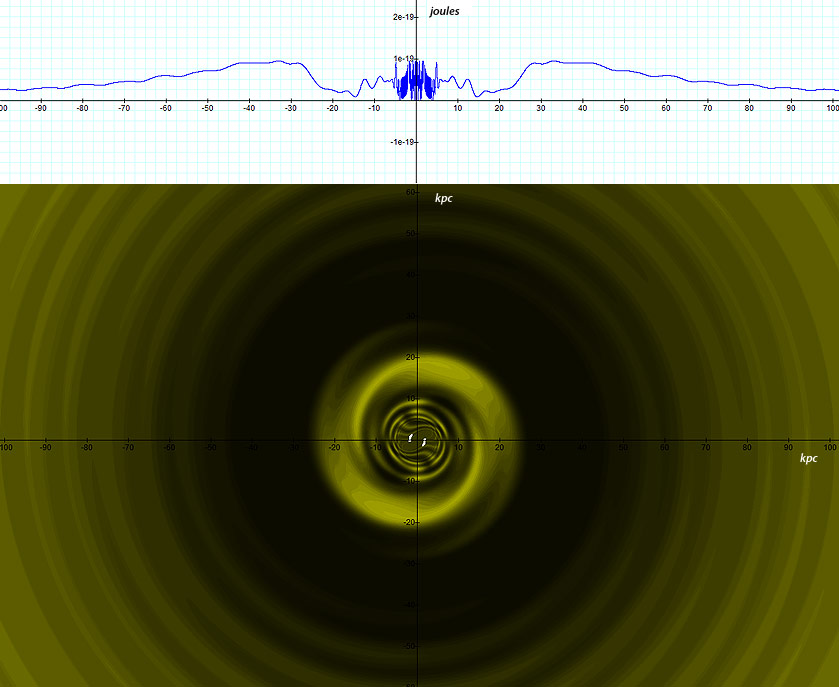
Figure 4-8d: When the
velocity of the SHP group is increased to  (using the same parameters of ,
,
(using the same parameters of ,
,
 ,
,
,
and ),
the potential energy at the galactic disk begins
to form into a spiral structure with two trailing arms, and the
central hourglass morphology begins to shift into
a bar structure. ,
,
,
and ),
the potential energy at the galactic disk begins
to form into a spiral structure with two trailing arms, and the
central hourglass morphology begins to shift into
a bar structure.
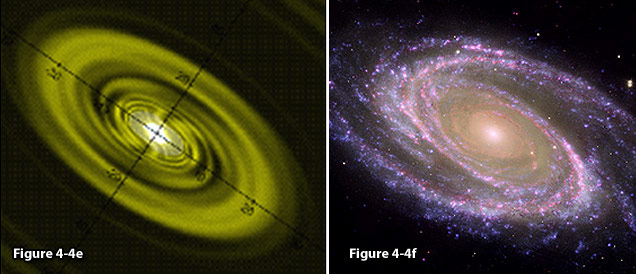
Figure
4-8e: Setting the
parameters  and and
 ,
the calculated model bears a close resemblance to the morphology
of the galaxy M81. ,
the calculated model bears a close resemblance to the morphology
of the galaxy M81. Figure
4-8f: provides a
composite of M81 from
NASAs Spitzer and
Hubble space telescopes
and NASAs Galaxy Evolution. Image
credits: NASAs
Spitzer and Hubble space telescopes and NASAs Galaxy Evolution
(NASA/JPL-Caltech/ESA
/Harvard-Smithsonian CfA);
http://www.nasa.gov/mission_pages/spitzer/multimedia/spitzer-20070604.html.
Note
the similarity between the calculated pattern displayed tilted in
figure 4-8e and the image of the galaxy M81 shown in figure 4-8f
after modifying
 and and . .
The dark section between approximately
 in figure 4-8g provides the external maximum at
 .
The galaxys visible border is located at its
minimum contour at approximately .
The galaxys visible border is located at its
minimum contour at approximately
 ,
and the area enclosed within this radius thus constitutes the
galactic disk. A focused view of the central part of ,
and the area enclosed within this radius thus constitutes the
galactic disk. A focused view of the central part of
 is provided in figure 4-8h, demonstrating a spiral morphology with
two external trailing arms as well as an internal spiral that
consists of both trailing and leading arms. While the trailing
spirals are located at the outer end of the visible spiral arms, the
leading spirals are located at the inner end of the spiral arms.22
Note that this model bears a close resemblance to the galaxy NGC-4622
depicted in figure 4-8i.
is provided in figure 4-8h, demonstrating a spiral morphology with
two external trailing arms as well as an internal spiral that
consists of both trailing and leading arms. While the trailing
spirals are located at the outer end of the visible spiral arms, the
leading spirals are located at the inner end of the spiral arms.22
Note that this model bears a close resemblance to the galaxy NGC-4622
depicted in figure 4-8i.
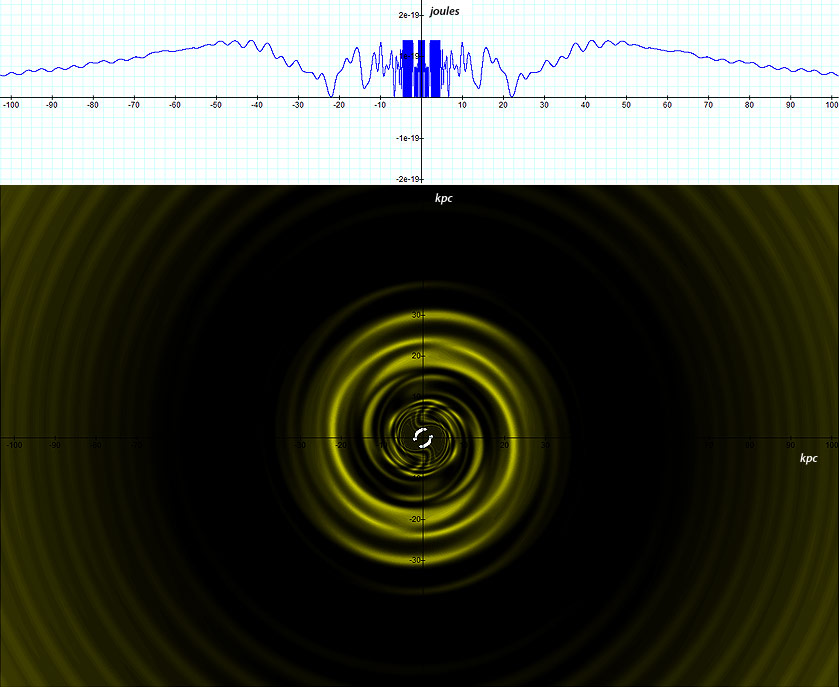
Figure 4-8g:
Increasing the speed of the SHP groups to  further strengthens the spiral structure and demonstrates both
leading and trailing spiral arms, providing a
morphology that resembles the galaxy NGC 4622.
further strengthens the spiral structure and demonstrates both
leading and trailing spiral arms, providing a
morphology that resembles the galaxy NGC 4622.
However, there is a clear difference between the modeled galaxy and
the observed NGC 4622 galaxy. While the modeled galaxy provides a
strong bar at its center, NGC 4622 demonstrates an unbarred or oval
structure. Accounting for the additional influence of ordinary
matter of mass of
 at the core of the modeled galaxy results in a non-barred spiral
morphology, shown in figure 4-8j. Therefore, the principal factor
that determines whether or not a spiral galaxy is barred or oval is
likely to be the relative amount of ordinary matter at its central
core, or the ratio
at the core of the modeled galaxy results in a non-barred spiral
morphology, shown in figure 4-8j. Therefore, the principal factor
that determines whether or not a spiral galaxy is barred or oval is
likely to be the relative amount of ordinary matter at its central
core, or the ratio
 . .
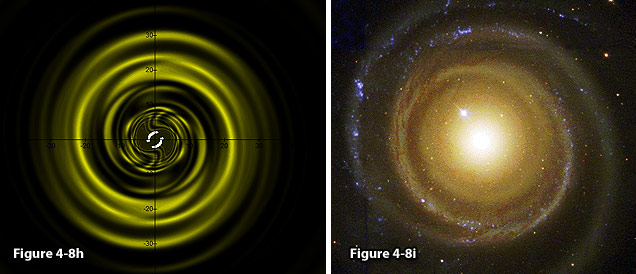
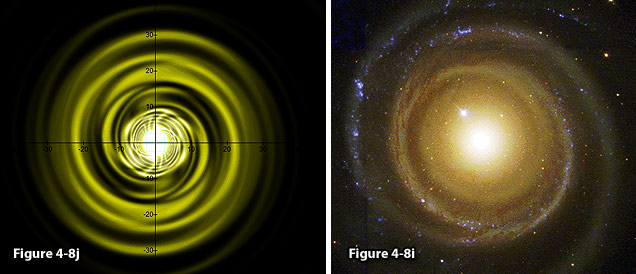
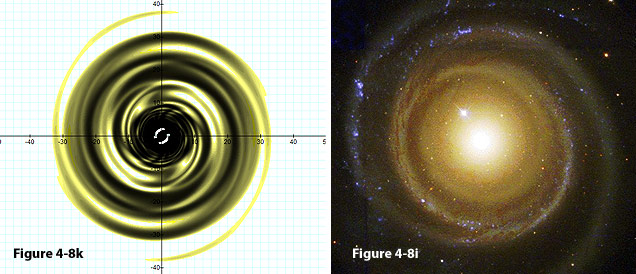
Figures
4-8h and 4-8i:
Comparison of the calculated galaxy to
NGC-4622 using ,
,
 ,
,
,
, ,
,
,
, ,
and .
Credit for Figure 4-8i:G. Byrd, R. Buta,
(Univ.Alabama,
Tuscaloosa), T. Freeman (Bevill
State College),
NASA;
http://apod.nasa.gov/apod/ap040221.html. ,
and .
Credit for Figure 4-8i:G. Byrd, R. Buta,
(Univ.Alabama,
Tuscaloosa), T. Freeman (Bevill
State College),
NASA;
http://apod.nasa.gov/apod/ap040221.html.
Figures
4-8j and 4-8i: Same
comparison as displayed in figure 4-8h and 4-8i, however the amount
of ordinary matter in the central disk at  is set to
  .
The central bar structure
of figure 4-8f is replaced by an oval bulge. .
The central bar structure
of figure 4-8f is replaced by an oval bulge.
Figures
4-8k and 4-8i: As the
dark background of figure 4-8j provides limited contrast with the
color of the calculated spiral arms,
a similar comparison is displayed in figures 4-8i and 4-8k, where an
inverted color scale is used (the maxima are indicated in light color
values and the minima are indicated in dark values).23
Section
IV-2-3: Flocculent Spiral
Structures
As the velocity of the SHP groups increases to
 in figure 4-9a, the arms of the modeled galaxy become more tightly
wound and segmented in appearance, bearing a resemblance to
flocculent structures, as observed in the galaxy NGC 488. To attain
a better fit, the rotation of the two SHP groups was reversed
relative to the previous modeled galaxies to a clockwise rotation (by
using
in figure 4-9a, the arms of the modeled galaxy become more tightly
wound and segmented in appearance, bearing a resemblance to
flocculent structures, as observed in the galaxy NGC 488. To attain
a better fit, the rotation of the two SHP groups was reversed
relative to the previous modeled galaxies to a clockwise rotation (by
using
 rather than
),
and the total mass of ordinary matter at the central core of the
galaxy was increased to
rather than
),
and the total mass of ordinary matter at the central core of the
galaxy was increased to
 . .
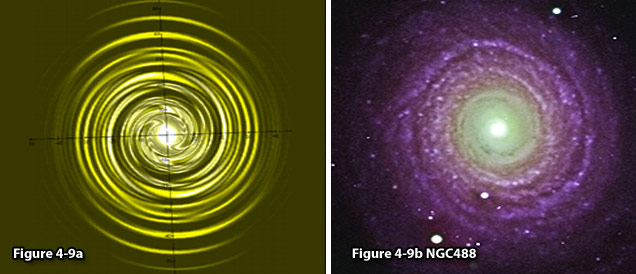
Figures
4-9a and 4-9b: Comparison between
a tilted view of the calculated galaxy and NGC
488,
using the same
parameters ,
,
,
 ,
,
,
and an increased speed of ,
,
,
and an increased speed of  .
The rotational direction of the SHP
groups was reversed to clockwise.24 .
The rotational direction of the SHP
groups was reversed to clockwise.24 Figure
4-9b: NGC
488,
image credit:
Johan Knapen and Nik Szymanek, Isaac Newton
group of telescopes. http://www.ing.iac.es/PR/science/ngc488.html.
Section
IV-2-4: Lenticular Galaxies
Lenticular galaxies are regarded as transitional objects
between elliptical and spiral galaxies. Similar to spiral galaxies
they contain a rapidly rotating disk and a central bulge, and similar
to elliptical galaxies they are often smooth and featureless, contain
little or no cool gas, and have minimal or no star formation. As the
transition between the various morphological classifications is
generally smooth, it is likely that more than one type of morphology
can fall under the broad definition of lenticular galaxies. Figure
4-10a provides an example of a calculated lenticular morphology.
Similar parameters to those used to model NGC 4622 in figure 4-8h
were applied,25
however the mass of ordinary matter at the center of the galaxy was
increased to
 .
Subsequently, the central bulge expanded to cover all of the minima
contours up to the zonal minimum indexed
(therefore, the central bulge almost extends throughout the entire
rotating galactic disk). The resultant morphology resembles the
lenticular galaxy NGC 2787, displayed in figure 4-10b. .
Subsequently, the central bulge expanded to cover all of the minima
contours up to the zonal minimum indexed
(therefore, the central bulge almost extends throughout the entire
rotating galactic disk). The resultant morphology resembles the
lenticular galaxy NGC 2787, displayed in figure 4-10b.
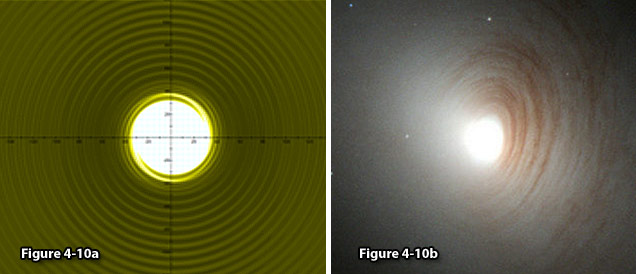
Figures
4-10a and 4-10b:
Comparison between a UG calculated galaxy (with face-on orientation)
and the lenticular
galaxy NGC 2787,
using the following parameters for
the calculation: ,
 ,
,
, ,
,
,
 and .
Image credit for figure
4-10b: Marcella
Carollo
(ETHZ),
Hubble
Heritage,
NASA;
http://apod.nasa.gov/apod/ap020408.html.
and .
Image credit for figure
4-10b: Marcella
Carollo
(ETHZ),
Hubble
Heritage,
NASA;
http://apod.nasa.gov/apod/ap020408.html.
Section IV-3: The
Red Square and the Red Rectangle
An interesting finding is made when zooming the display around one of
the SHP groups to about 100pc, as shown in figure 4-11a. The figure
depicts several concentric crisscrossing isophotes, which emerge in
patterns that bear a striking resemblance to MCW 922, the Red Square
Nebula, and to the Red Rectangle provided by figures 4-11b and 4-11c
respectively. In 2007 Peter Tuthill and James Lloyd reported the Red
Square nebula to consist of a box-shaped X structure which necks down
into identical opposing hyperbolic bicones, a series of orthogonal
linear rungs, and a series of radial linear features resembling a
comb that lie along the bicone surfaces (between the rung and the
outer edge of the nebula). They additionally noted that the
structures are, to a remarkable extent, reflection symmetric about
the principle axis (Tuthill & Lloyd, 2007). All of
these features appear in the marked sections of figure 4-11a.
According to Tuthill and Lloyd, The finding of a cousin to the
Red Rectangle, but with differing spectrum and a hotter central star,
implies that the conditions of formation for these elegant bipolar
ladders may not be so singular and unique as formerly thought.
Indeed, the fact that several (at least four) such structures were
found in this single model figure, and that they are very similar in
general appearance yet somewhat differ in particular features,
suggests that there may be many such structures even within a single
galaxy.
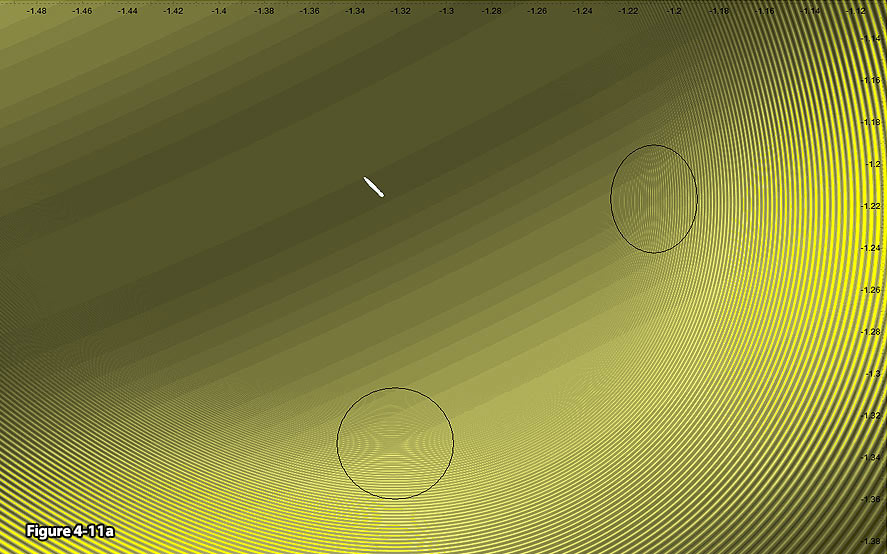
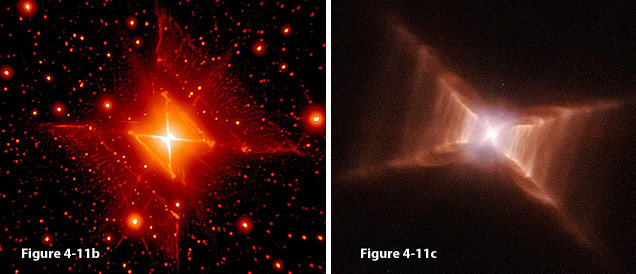
Figure
4-11a: Provides a
high resolution image of the same galaxy modeled in figure 4-8h,
using ,
,
,
,
 ,
and ,
and .
The display is zoomed
to about .
The display is zoomed
to about  around one of the SHP
groups. The circled areas
bear a striking resemblance to MCW 922, the Red Square
Nebula, and to the Red Rectangle
shown in figures 4-11b and 4-11c respectively (note that aside from
the two circled patterns, there are few more similar unmarked
patterns). Note that for the purpose of clarity, the color scheme is
reversed, where the darker color values indicate lower potential
energy.
around one of the SHP
groups. The circled areas
bear a striking resemblance to MCW 922, the Red Square
Nebula, and to the Red Rectangle
shown in figures 4-11b and 4-11c respectively (note that aside from
the two circled patterns, there are few more similar unmarked
patterns). Note that for the purpose of clarity, the color scheme is
reversed, where the darker color values indicate lower potential
energy. Figure
4-11b:MWC
922: The Red Square
Nebula credit(Tuthill
& Lloyd, 2007);
http://apod.nasa.gov/apod/ap070416.html. Figure
4-11c: The Red
Rectangle, Image credit:
H. Van Winckel (KULeuven),
M. Cohen (UC Berkely), H. Bond (STScI), T. Gull (GSFC), ESA, NASA;
http://www.nasaimages.org/luna/servlet/detail/NVA2~4~4~5326~105852:
Rungs-of-the-Red-Rectangle.
Section
IV-4: Companion Galaxies Figure
4-12a provides the calculated potential energy of an ordinary
particle of mass
 within the plane of a galaxy with one companion. The parameters of
the main galaxy are given by
within the plane of a galaxy with one companion. The parameters of
the main galaxy are given by
 , ,
 , ,
 , ,
 , ,
 and and
 ,
and the parameters of the companion galaxy are given by ,
and the parameters of the companion galaxy are given by  , ,
 , ,
 , ,
 , ,
 , ,
 and
and
 (figure 4-12a). The general structure of the calculated morphology
bears a resemblance to the cartwheel galaxy shown by the Hubble Space
Telescope (HST) image (figure 4-12b). The two galaxies on the left
side of the image are companion galaxies. A similar pattern of
beads on a string was spotted in Andromeda and number
of other galaxies with nearby companion. A comparable pattern is
also apparent in figure 4-13, displaying the effect of a companion on
supernova 1987A.
(figure 4-12a). The general structure of the calculated morphology
bears a resemblance to the cartwheel galaxy shown by the Hubble Space
Telescope (HST) image (figure 4-12b). The two galaxies on the left
side of the image are companion galaxies. A similar pattern of
beads on a string was spotted in Andromeda and number
of other galaxies with nearby companion. A comparable pattern is
also apparent in figure 4-13, displaying the effect of a companion on
supernova 1987A.
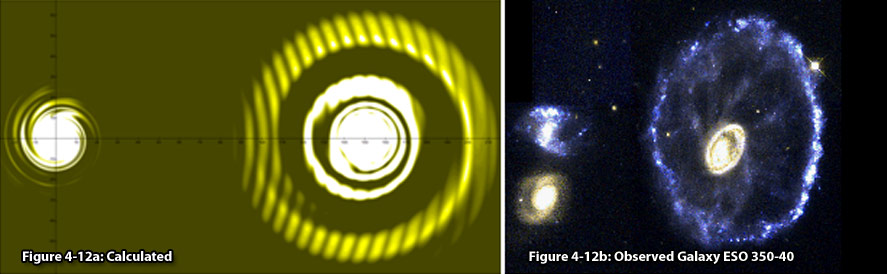
Figure
4-12a: UG calculated
image
Figure
4-12b: Observed
Cartwheel Galaxy ESO
350-40,
image credit: NASA, ESA,
and K. Borne (STScI)http://hubblesite.org/gallery/album/pr2007017d.
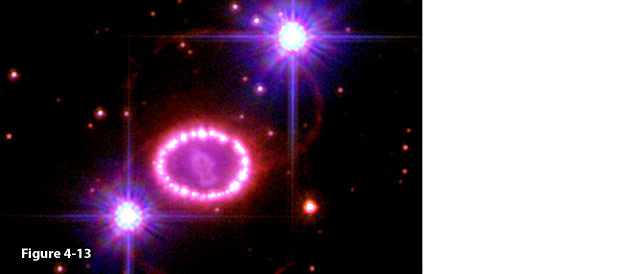
Figure
4-13: Supernova 1987A,
image credit: NASA, ESA,
P. Challis and R. Krishner (Harvard-Smithsonian Center of
Astrophysics); http://www.nasa.gov/multimedia/imagegallery/image
feature 773.html.
Section
IV-5: Multiple SHP Groups
In the above examples, a simple model based on as little as four or
five independent parameters (,
,
(or
),
and
(for the case of binary SHP groups)) of a single galaxy composed of a
single or binary SHP groups and ordinary matter was demonstrated to
account for a variety of galactic and nebular morphologies. However,
as real physical systems are likely to contain multiple types of
superheavy particles and multiple SHP groups, the UG model may be
extended to cover more complex cases. To start, a galaxy may contain
multiple SHP groups rotating around the central core at different
velocities and at various orbital radii. However, following the
logic provided in section III-3, the orbits of the SHP groups are
nearly circular and their rotational velocities are determined
uniquely by their radii via equation 3-3-1, where
 .
Therefore, any additional SHP group requires the addition of three
or four independent variables ( .
Therefore, any additional SHP group requires the addition of three
or four independent variables ( , ,
 , ,
 and
and
 ).
Following the third section of chapter III, all of the SHP groups
with orbital radii shorter than their zonal oscillation range with
ordinary matter must comply with ).
Following the third section of chapter III, all of the SHP groups
with orbital radii shorter than their zonal oscillation range with
ordinary matter must comply with
 ,
and must rotate together as a rigid body, in unison with the central
core of the galaxy. A model of multiple SHP groups will be applied in
the following chapter for a UG analysis of Saturns ring
system. ,
and must rotate together as a rigid body, in unison with the central
core of the galaxy. A model of multiple SHP groups will be applied in
the following chapter for a UG analysis of Saturns ring
system. The
UG model can be further extended by allowing some SHP orbits to
deviate from the rotational plane of the galaxy. Substantial
deviation, for instance a deviation of
 ,
may explain the structure of polar ring galaxies while a lesser
amount of deviation may explain the structure of ESO
510-G13, displayed in Figure
4-14. ,
may explain the structure of polar ring galaxies while a lesser
amount of deviation may explain the structure of ESO
510-G13, displayed in Figure
4-14.
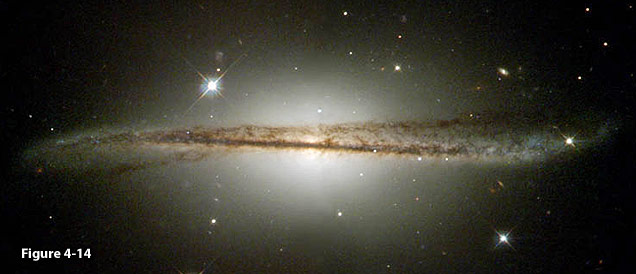
Figure
4-14: An
edge-on view of the galaxy ESO 510-G13,
image credit: NASA,
the Hubble Heritage Team, and C. Conselice;http://heritage.stsci.edu/2001/23/caption.html.
1
At  ,
this simplifying assumption can replace the more restrictive
assumption of a homogeneous
distribution of ordinary matter within the galaxy or nebula. ,
this simplifying assumption can replace the more restrictive
assumption of a homogeneous
distribution of ordinary matter within the galaxy or nebula. 2
For clarification, while the energy of the object is modified by
these transformations, the galaxy morphology,
which is driven by the location of the minima, is unaffected by the
reduction of  and
and  to
to  .
However, the amount of galactic radiation will decrease (see
theorem A-2 in Appendix A). .
However, the amount of galactic radiation will decrease (see
theorem A-2 in Appendix A). 3
Note that the energy required for the creation of superheavy
particles is assumed to
be generated by the vast amount of energy released during the
collapse of a cloud of gas composed of ordinary matter toward its
center. In the process of collapse, the moment of inertia of the
collapsing gas cloud is reduced by a large factor, or  .
As the total angular momentum of the cloud needs to be preserved,
or .
As the total angular momentum of the cloud needs to be preserved,
or  ,
even a very small initial angular velocity ,
even a very small initial angular velocity  will be accelerated to high angular velocity
  .
Therefore, the angular velocity of the galaxys central core
and its SHPs should become elevated immediately after the collapse.
However, over time the galaxys angular momentum may be
reduced substantially by a number of mechanisms, such as galactic
wind or collisions
between galaxies,
resulting in a gradual slowing of the rotation of the galactic core
and its superheavy particles. .
Therefore, the angular velocity of the galaxys central core
and its SHPs should become elevated immediately after the collapse.
However, over time the galaxys angular momentum may be
reduced substantially by a number of mechanisms, such as galactic
wind or collisions
between galaxies,
resulting in a gradual slowing of the rotation of the galactic core
and its superheavy particles. 4Recall
that at distances  ,
the exponent ,
the exponent  ,
and that the maxima and the minima of equation 4-1-1a occur when
both ,
and that the maxima and the minima of equation 4-1-1a occur when
both  and
and  are equal to
  or
respectively. Using the assumed values of ,
,
or
respectively. Using the assumed values of ,
,
 ,
,
and ,
,
and  (and therefore
  ),
the resultant potential energy is given as ),
the resultant potential energy is given as  at the maxima, and as virtually zero energy at the minima. Further
note that the overall color value at the center of this hypothetical
galaxy is relatively dark. This is due to the arbitrary and
unrealistic assumption that the galaxy contains only SHPs and no
ordinary matter ().
In a more realistic model, where
at the maxima, and as virtually zero energy at the minima. Further
note that the overall color value at the center of this hypothetical
galaxy is relatively dark. This is due to the arbitrary and
unrealistic assumption that the galaxy contains only SHPs and no
ordinary matter ().
In a more realistic model, where  is substantially large, the center appears brighter than the
surrounding galaxy (see figures 4-4d, 4-8e, 4-9a and 4-10a).
is substantially large, the center appears brighter than the
surrounding galaxy (see figures 4-4d, 4-8e, 4-9a and 4-10a). 5
Note that according to equation 4-1-1a, the radii of the minima
circles are dependent on the SHP
mass and are independent of the number of superheavy particles
in each SHP group. 6
This is correct since typically  and
and  are greater than or of the order of
  ,
while ,
while  .
Therefore, .
Therefore,  .
In addition, the influence of ordinary matter is assumed to be
negligible at this point of the discussion. .
In addition, the influence of ordinary matter is assumed to be
negligible at this point of the discussion. 7A
more detailed explanation of how stars
are formed and the influence of rotation on the process will be
discussed later on in chapter VI. A similar mechanism on larger
scale can create entire galaxies
(within clusters), which in turn generates a large population of
stars. Thus, the
panoramic view of the night sky consists of galaxies
and stars. 8
When the two intersecting points are sufficiently close, two nearby
star systems are likely to form. If the two stars
are sufficiently massive, the gravitational interaction between them
may become stronger than their interaction with the galaxy center,
and they may consequently begin to orbit around each other as well
as around the galaxy center. This can explain the occurrence of
binary star systems, as well as their low abundance relative to the
number of single star systems. This may further be applied within
the Solar System to
provide a possible explanation for how the Earth
and Moon system was
created. 9
This is true as long as the assumption that the two groups consist
of superheavy particles
of equal mass holds true. 10In the example
provided in the figure, the closest intersection to the SHP
groups is at a distance of about  to
to  from one group, and about
from the other. It is possible to estimate the minimum star size by
either zooming the display around the minimum point to a sufficient
display resolution, or by applying equation 2-1-12 to calculate the
indices
from one group, and about
from the other. It is possible to estimate the minimum star size by
either zooming the display around the minimum point to a sufficient
display resolution, or by applying equation 2-1-12 to calculate the
indices  of the contours generated by each SHP
group and equation 2-1-16 to calculate their estimated widths.
of the contours generated by each SHP
group and equation 2-1-16 to calculate their estimated widths. 11
See section VI-4. 12
In the Newtonian scenario, the SHP
groups must rotate around each other, or otherwise collapse into
each other. Thus, the scenario of no rotational velocity is
unstable. According to the UG theory, this is not necessarily the
case for two massive superheavy particles,
since two SHPs can be kept apart by the rejection zones
(or maxima) created by their interaction. 13
Nebulae of this type are currently believed to have been formed by
the outflow of gas from a massive central star and to be relatively
short-lived phenomena, lasting only a few tens of thousands of
years. According to unified gravitation,
the structure of a nebula is determined by the mass of its core of
ordinary matter and by the size, quantity and orbit of its SHP
groups. Therefore, as long as the above parameters are not subject
to significant change, nebular morphology
is a long-lasting phenomenon. 14The first scaling theorem is
discussed in Appendix A. 15In this example,  and ,
and do not need to be taken into account.
and ,
and do not need to be taken into account. 16
Additional classes and sub-classes have been added over time, for
example Arps
peculiar class, which includes a class of ring galaxies.
17
Alternatively, Lin
and Shu assumed
that the spiral pattern is a long lasting stationary density wave. 18
The dependency of the size of the galaxy in the direction parallel
to the direction of the velocity of a superheavy particle group can
be proportional to  ,
due to the contribution of ,
due to the contribution of  in the denominator of the cosine operand, and the fact that
  can be reduced by a factor of
  in the parallel direction.
 19
The radius of the most external minimum actually resides at a
farther distance, at approximately  .
However, at this distance the UG equation becomes almost
indistinguishable from the Newtonian equation, and since the total
mass of the superheavy particles
is significantly smaller than the total mass of ordinary matter in
the galaxy, the minimum contour at .
However, at this distance the UG equation becomes almost
indistinguishable from the Newtonian equation, and since the total
mass of the superheavy particles
is significantly smaller than the total mass of ordinary matter in
the galaxy, the minimum contour at  would not be noticeable. Instead, a minimum contour occurs
somewhere between the maximum contour
would not be noticeable. Instead, a minimum contour occurs
somewhere between the maximum contour  and the minimum contour
at the point where the rate of change of the ordinary matter
contribution to the potential energy of the object is equal in
magnitude, but opposite in sign to the rate of change of the
galaxys SHP
contribution. As this minimum occurs at greater distance from the
galaxys main body, where the UG equation becomes almost
indistinguishable from the Newtonian equation, and as the
contribution of the galaxys ordinary matter to the potential
energy of the object is also substantially reduced at the given
distance, the visual effect of this additional minimum contour is
relatively small.
and the minimum contour
at the point where the rate of change of the ordinary matter
contribution to the potential energy of the object is equal in
magnitude, but opposite in sign to the rate of change of the
galaxys SHP
contribution. As this minimum occurs at greater distance from the
galaxys main body, where the UG equation becomes almost
indistinguishable from the Newtonian equation, and as the
contribution of the galaxys ordinary matter to the potential
energy of the object is also substantially reduced at the given
distance, the visual effect of this additional minimum contour is
relatively small. 20
Some stars may form due
to interactions of the single dominant SHP
group and lesser SHP
groups (smaller in size or quantity), or due to gravitational
interactions with companion galaxies
or nebulae. 21
Further explanation is provided in Chapter VI. 22
It will be demonstrated that in the case of rapid SHP
rotational velocities, the visible galactic arms are actually part
of a larger trailing spiral structure that begins at the central
nucleus and continues far
beyond the galactic disk.
However, only some sections of the spiral have sufficiently low
potential energy and a high enough density of matter to emit
substantial radiation. The perceived morphology
therefore displays shorter segments of spirals with leading inner
and trailing outer edges. 23
Note that the two white arcs at the central bulge
are simply a calculation artifact, which occurs at extremely high
potential energies where calculated numbers exceed the numeric range
of the computer/graphical program. In such cases the pixel remains
white. However, even those artifacts can provide useful information
as they indicate the general areas where the SHP
groups are located. 24
Note that the image was calculated in a face-on orientation, and
then tilted
 around the
axis and
around the
axis and  around the
axis, both counter-clockwise.
around the
axis, both counter-clockwise. 25
The following parameters were used: ,
 ,
,
, ,
,
, and
and  . .
|